Cover Crops: Soil Water and Small Grain Yield and Protein
Last Updated: 01/22by Clain Jones, Soil Fertility Extension Specialist/Professor; Kathrin Olson-Rutz, Research Associate; Perry Miller, Cropping Systems Professor; Cathy Zabinski, Belowground Ecology Professor; and Susan Tallman, State Agronomist and Certified Crop Adviser
Overview
Fallow-based cropping systems have been profitable and often less agronomically risky than re-crop. However, their use is damaging to soil health and may limit long-term profitability. Cover crops (also called covers) can partially reduce summer fallow. Although covers can provide roots and above ground residue to improve soil health, they use stored soil water. In semi-arid dryland cropping systems, early cover termination is key to minimizing subsequent cash crop loss due to cover water use.
Legume covers can provide nitrogen (N) for subsequent crops. Wheat protein is often higher following legume cover than fallow, but it can take several rotations of legume cover to provide a substantial N credit allowing reduced N fertilization rates. The amount and timing of N released from cover residue is highly variable. It is important to spring soil test for soil nitrate-N to avoid over- or under-fertilization of that year’s cash crop.
The focus of this publication is on covers in the semi-arid northern Great Plains as ‘greening’ or partial replacement of the summer fallow period, and their impact on soil water and the following small grain crop. The companion publication Cover Crops: Management for Organic Matter and Nitrogen presents cover crop diversity and termination timing, and Cover Crops: Soil Health presents covers’ effect on soil biological, chemical, and physical properties. The MontGuide Cover Crops as Partial Replacement of Dryland Fallow presents the main summary information of these three bulletins. Covers for forage (hay or grazed) will be discussed in a later bulletin.
For successful covers, follow suggested agronomic practices for the cover species used. Information on seeding rates are in USDA Technical Notes and cover species appropriate to Montana are in Montana Agricultural Experiment Station publications under Resources at the end of this bulletin.
Most Montana State University trials target seeding covers to achieve eight plants per square foot (Miller pers. comm.). Soil testing should be done to determine if soil levels are adequate for N, phosphorus (P), and potassium (K). See Fertilizer Guidelines for Montana Crops for both soil ‘critical levels’ and fertilizer rates for common Montana crops. Nitrogen should not be added if legumes represent more than about one-third of a cover species mix to favor legumes and take advantage of free N fixation. If soil nitrate levels are below 10 lb N/acre, legumes can benefit from 20 lb N/acre starter N. Starter N may reduce pea seedling establishment if soil N is greater than 20 lb N/acre (1). If legumes are less than a third of a cover mix, then follow N guidelines for grass (25 lb available N/ton). If fertility has been maintained near or above critical levels for P and K, it is likely additional P and K are not needed for the cover crop, in part because covers are generally terminated well before maturity so they require somewhat lower nutrient inputs.
Soil Water
Covers use soil water through plant growth (transpiration). They can help maintain soil water by shading and reducing wind at the soil surface, and trapping snow. However, in semi-arid regions of Montana, soil water used to grow covers, even if they are terminated early, is generally greater than soil water saved through decreased evaporation. Over the long-term, covers may increase soil water holding capacity if they increase soil organic matter.
Typically, soil water content of summer fallow peaks in June, after which evaporation is greater than soil water gain from rainfall, and stored soil water decreases over the summer. Tilled fallow lost on average 4.2 inches of water in July and August at two Montana sites over two years (2). Summer rainfall might be better used in growing crop biomass than evaporating. However, fields with spring/summer covers usually end up with 1 to 2.5 inches less soil water in the fall than fallow (3, MT), or more if covers are terminated at pod (Figure 1). Sometimes overwinter recharge can bring spring soil water levels in cover cropped fields close to fallow (2008 and 2010), but not always (2009).
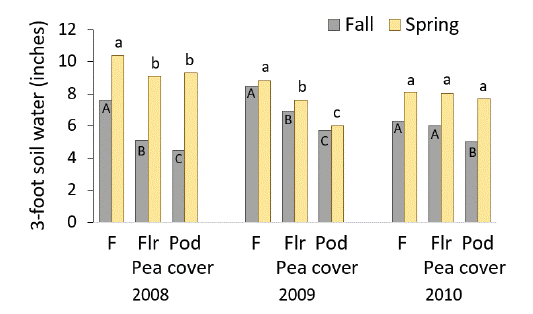
Figure 1. Soil water mid fall and the following spring after fallow (F) and pea terminated at either flower (Flr) or pod. Bars with different letters within a year and season are different with 95% confidence (5, Amsterdam, MT).
Over-winter covers and residue from full-summer covers may increase overwinter moisture capture (Table 1). Such overwinter snow capture is dependent on tall standing stubble. Even though covers may capture or retain more water over winter than fallow, cover fields in the semi-arid northern Great Plains generally have less soil water in the spring than fallow (Figure 2).
Whether fallow or covers were chemically treated or tilled, did not affect growing season water loss (3, MT).
Table 1. Field cover affects change in soil water overwinter in top 4-feet. Averaged over 4 winters (6, Williston, ND, 3.4 inches average overwinter precipitation).
| Prior Crop | Soil water change (inches) |
| Fallow | 0.2 loss |
| Short grain stubble | 1.5 gain |
| Perennial mix stubble | 2.5 gain |
| Full season summer mixed cover stubble | 2.9 gain |
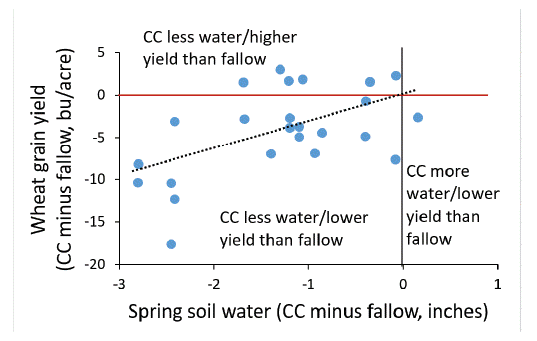
Figure 2. The differences in wheat grain yield and spring soil water (to 3-ft depth) after a cover crop (CC) compared to fallow. Cover crops were terminated at first flower, fullbloom, or pod stage. The zero on either axis means there was no difference between cover crop and fallow. For example, the value (spring soil water, grain yield) (-1,-7) means the cover crop had 1 inch less soil water the following spring and produced 7 bu/ac less wheat than fallow (5, 7, 8, 9, all MT; 10, SK).
Small grain yield
In studies across the semi-arid region of Montana and Canada’s northern Great Plains, small grain yields ranged from 30 bu/acre less to 9 bu/acre greater after a legume cover than fallow (3, 4, MT). Generally, yields were lower when spring soil water was lower – about 3 bu/acre for each inch of lower soil water - but often covers had essentially no major effect on yields (Figure 2).
In shallow soils with limited water holding capacity, soil water is more likely to be similar following a cover, cash crop, or fallow. Therefore, covers have less relative impact on stored soil water, and grain yields can be equal following covers, re-crop and fallow (11, Moccasin, MT).
Based on 10 site-years of dryland Montana data, cover species can affect the following wheat yields. Wheat yields were often higher after 2-legume cover (spring pea, lentil) than the 2-species mixes without legume (Figure 3A). Brassica cover (daikon radish, winter canola) appeared to benefit wheat yields in the site-years where legume cover did not (Figure 3B). Wheat yields were sometimes lower following tap-rooted cover (purple top turnip, safflower; Figure 3C), and usually lower after fibrous-rooted cover (oat, canary seed; Figure 3D) than 2-species mixes without those functional groups. However, adding a functional group (e.g., legume) to a 6-species cover mix to create an 8-species mix, had little effect on subsequent wheat yields (8). This is likely because the added functional group gets diluted by the other six species. Water is the overriding influence on wheat yields following cover. The effect of cover composition (species and number of species) in a given year on the following wheat yields was generally smaller than yearly variation in wheat yield after fallow (data not shown).

Figure 3. The change in wheat yield on 10 Montana dryland site-years following 2-species mixes of A. legume (spring pea, lentil) vs. non-legume, B. brassica (daikon radish, winter canola) vs. non-brassica, C. tap- (purple top turnip, safflower) vs. nontap root, and D. fibrous (oat, canary seed) vs. non-fibrous root covers (e.g., Figure A is the 2-species legume cover minus the average of 2-species brassica, 2-species tap-root, and 2-species fibrous-root covers). Numbers indicate crop-year (e.g., 14 = 2014). The letter in front of crop-year indicates site, A = Amsterdam, B = Bozeman, C = Conrad, D = Dutton. Statistics were only available for Figure A. In site-years with *, yields after legumes were significantly higher than after non-legumes with 95% confidence (8).
Termination
In dry climates, termination timing is the key management choice for soil water and subsequent crop yields. Tillage or chemical termination at late bud to first bloom, instead of waiting for maximum biomass, conserves soil water, and increases subsequent wheat yields and net revenue (3, Culbertson, MT; 10, southwest SK). Since the cash crop is likely greater following early-terminated rather than late-terminated covers, greater cash crop stubble partially counterbalances the lower cover biomass from early-terminated cover.
In water limited conditions, when covers were terminated by first bloom, wheat after pea and 2-to 8-species cover mixes in 13 site-years yielded an average 8.6 bu/acre less than after fallow (8, 9, 12, 13, MT). In contrast, small grains following late-terminated covers yielded an average 15.3 bu/acre (range = 2.4 to 30.3 bu/acre, 6 fields) less than following fallow (4, MT). Cover biomass produced after first flower takes a heavier toll on subsequent small grain yield (19 bu/acre per ton late-terminated cover biomass) than cover biomass produced before flower (9 bu/acre per ton early-terminated cover biomass). Extending cover growth from pod to seed set further reduced subsequent wheat yields (14, MT). While with higher rainfall, grain yields were not significantly less after covers than fallow, regardless of cover termination timing (Figure 4).
The effect of tillage versus chemical termination of cover on subsequent small grain yield is inconsistent. Termination by tillage reduces near surface soil water but may preserve deep soil water by causing rapid rather than a lingering death by herbicide with slow but continued water use (15). Shallow tillage may also interrupt water flow from wet soil to dry surface soil, thus reducing evaporation. Also, nitrogen is more quickly released from tilled than chemically-terminated cover residue to benefit wheat grain yields and protein (7, MT). However, tillage will reduce stubble and potential snow-catch for overwinter water recharge. In a 10-year study with 12-inch annual rainfall, spring wheat yields were the same following lentil cover terminated by tillage or herbicide (3, MT). The switch to no-till seeding of spring wheat appeared to be the key to bring wheat yields following covers equal to after-fallow, whether the covers were tilled or not.
Mowing, haying and grazing are also options to terminate covers. Integrating covers with forage production is outside the discussion of this bulletin.
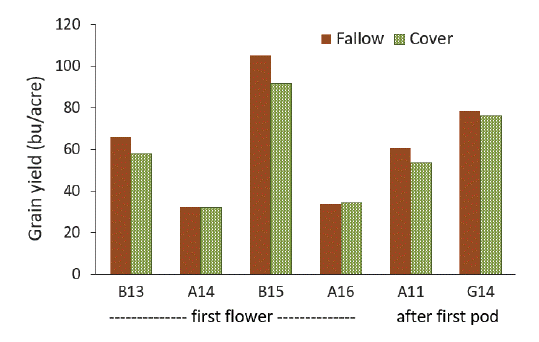
Figure 4. Small grain yields following fallow and cover terminated by first flower or after flat pod on wet Montana site-years (greater than 6.5 inches April – July). Yields were no different between fallow and cover with 95% confidence. A= Amsterdam, B=Bozeman, G=Great Falls (4).
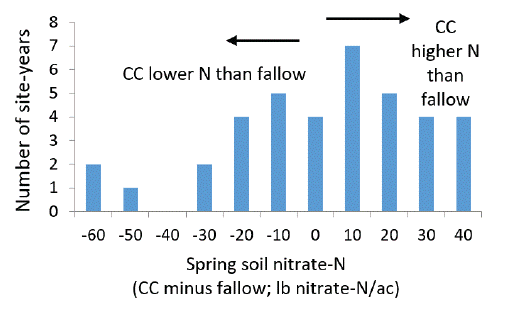
Figure 5. The number of times spring soil nitrate-N was less or greater after a legume cover crop (CC) than fallow. Positive soil nitrate-N means more soil nitrate after cover than after fallow. A value of 10 means the difference was between 5 and 15 lb N/acre (3, 5, 7, 8, 9, 12, 13, all MT; 10, SK).
Nitrogen
Cover crop composition, termination timing, and tillage effect on plant available N contributed by covers are discussed in Cover Crops: Management for Organic Matter and Nitrogen. Here we focus on the potential N benefit from cover residue on subsequent small grain yield and protein.
For small grain yield
In Montana’s cool, semi-arid regions, the release of available N from pulse cover residue can be too slow to meet small grain’s early growth N requirements. Yet, if fall conditions are moist and relatively warm, legume cover may decompose quickly and supply N for vigorous early small grain growth. If the growing season turns dry, that growth cannot be sustained resulting in very low grain yields (8).
Spring soil N can be hard to predict, even on a given field over several years. Spring soil nitrate levels may be higher or lower after legume cover than fallow (Figure 5), regardless of whether the cover field had higher or lower soil nitrate in the fall (3, Culbertson, MT). The range in outcomes is large because legumes can scavenge high amounts of nitrate if there is plenty available or can fix substantial N if nitrate is low.
The N credit is how much N fertilizer a producer can back-off of a fertilizer N recommendation to get similar yield and protein as when no legume was grown prior to that crop. It is difficult to measure. As a rule of thumb, an annual legume cover grown once can provide 20-30 lb N/acre N credit the following year. After a third time in rotation with small grain, an annual legume cover may provide 30-50 lb N/acre for the following crop. Details of N contribution by legume covers is discussed in Cover Crops: Management for Organic Matter and Nitrogen.
Several long-term studies suggest that N benefits to wheat yield may be realized only after multiple years of legumes in rotation (3, MT; 16, SK), especially in no-till systems (17, SK). A lack of immediate N benefits could be discouraging. Plant available N from pulse residue takes time to build (18, MT), but tends to be available for a long time; N from legume residue may still supply N for grain planted three years later (19, AB, MB, SK).
Since N contribution from legume covers can be highly variable (20), soil N levels should be tested, and fertilizer N rates adjusted following covers. Soil nitrate testing is best done in the spring, but if fields are predictably too wet to sample in early spring, then test in late fall (Interpretation of Soil Test Reports for Agriculture). Fertilizer N rates can be reduced from standard guidelines when legume covers are used due to increased fertilizer N recovery (21, Bozeman, MT) and N supplied in the long term (10, Swift Current, SK). Reducing fertilizer N rates in turn will reduce fertilizer costs, minimize leaching loss (22, SK), and slow soil acidification from ammonia- based N fertilizer (23).
In some situations, N rather than water limits subsequent small grain yields and possibly protein, especially if the crop year after covers is relatively wet (9, MT). Nitrogen limitation can be avoided by spring soil testing and adequate N fertilization.
For small grain protein
Small grain protein is greater after legume covers than fallow the majority of the time (Figure 6). Legume cover benefits to small grain protein occur after fewer rotations than necessary to see N benefits to small grain yields. In a Culbertson, Montana, study, small grain protein was consistently equal following cover and fallow after two rotations of lentil cover, while grain yields were equal after three rotations (3).
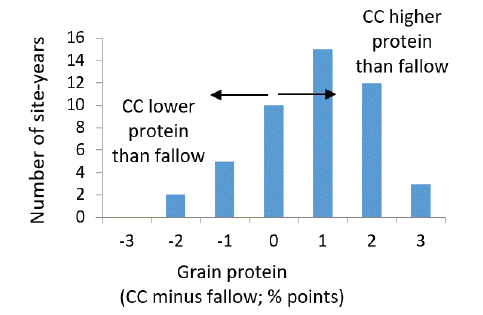
Figure 6. The number of times small grain protein was lower or higher after a legume cover (CC) than fallow over 47 site- years. Positive protein means cover crop produced higher protein than fallow (3, 4, 5, 8, 9, 12, 13, all MT; 10, SK).
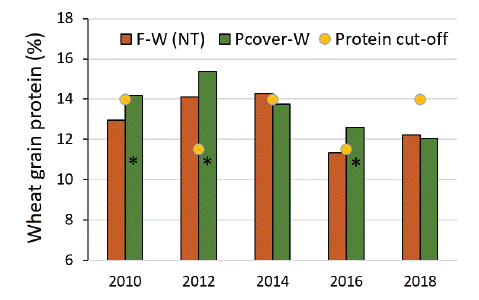
Figure 7. Wheat grain protein after fallow or pod-stage terminated pea cover, and the protein discount cut-off level for spring wheat (14%, 2010, 2014, 2018) and winter wheat (11.5%, 2012, 2016). Pcover bars with * are greater than fallow with 90% confidence (8, Gallatin Valley, MT).
In a long-term Montana study, wheat grain protein was consistently the same as or greater after pea terminated around pod-stage than after fallow (Figure 7). Wheat grain following pea cover reached or exceeded the protein cut-off level in most years, despite receiving 54 lb N/acre less fertilizer than the wheat after fallow (8). Tillage and chemical termination produced similar grain protein (7, Amsterdam, MT).
Economics
Cover crop success must be evaluated over many years and across the whole production system. Economics of using covers in the northern Great Plains are inconsistent. The economics of covers can be improved by 1. basing subsequent N fertilizer rates on spring soil nitrate-N levels, 2. giving an N credit if N was provided by a legume cover, 3. getting a tangible product such as forage during the cover crop year, 4. time, as soil health benefits build up, and 5. precipitation.
In a long-term cropping systems study near Bozeman, Montana, pea covers (hayed or sprayed) followed by wheat were economically similar to fallow-wheat, despite higher management costs (Figure 8). Due to improved soil N supply in synchrony with subsequent wheat growth, the system was less reliant on fertilizer N. This area has relatively high annual precipitation (16.3 inch), causing very little to no soil water cost associated with the pea cover crop. Also, N fertilizer was added based on soil tests and reduced after legumes. Note that at least for these eight years, net profit from the pea grain-wheat rotation (Pea-W) far exceeded profit from the cover-wheat or any other rotation in the study. Recrop with legumes in rotation is likely more profitable than legume covers (25) and minimizes the soil health loss of fallow while also contributing to plant available N.
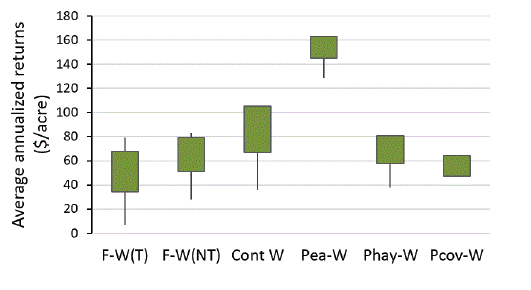
Figure 8. Average annualized net returns, 2009–2016, Bozeman, MT. Boxes represent the average +/- standard error and tails depict maximum and minimum values. F = fallow, T = Till, NT = no till, Cont W = spring wheat - winter wheat, Pea = pea grown for grain, Phay = pea harvested for hay then chemically killed, Pcov = pea cover chemically killed, W = wheat (24).
In contrast, at ‘low rainfall’ sites in Dutton (2011-2016 average annual precipitation 11.1-inch) and Big Sandy (2012- 2017 11.3-inch), Montana, after six years, average net returns from the pea cover – wheat system were about $200/acre less than chem fallow-wheat. Soil water was much more limiting to crop yield than N at these low rainfall sites (14).
A 12-year Saskatchewan study compared early-terminated legume covers with minimum tilled fallow. Costs were lower in the system with cover than fallow for N fertilizer, tillage and herbicide, and gross income was greater due to higher wheat grain protein. These economic benefits more than offset the seed and labor costs of the pulse cover for a higher profit than fallow (10, 8-inch growing season, 14-inch annual precipitation).
Slow and low N benefits of legume covers have a hard time competing economically with conventional N fertilizer in semi- arid dryland systems. However, chemical N fertilizer can have environmental and soil health costs such as soil acidification, that are far less likely to occur with N from legume residue.
Summary
A main benefit of covers is to reduce fallow and provide residue for soil health. The drawback is that growing plant cover during the non-cash crop year uses enough soil water to generally reduce cash crop yields.
- In water-limited systems, cover termination by first flower is key to minimize next crop yield loss due to cover water use.
- Residue gained by growing past flower does not offset the water use and subsequent cash crop yield loss.
- Cover species should be selected that produce reliable biomass, keeping in mind seed costs.
- Recrop with legume in rotation can provide similar benefits as legume cover and is likely more profitable.
Plant available N is hard to predict and does not necessarily increase even with legume covers.
- Soil testing should occur in the fall or following spring to adjust N fertilization rates.
- It takes several legume cover rotations to provide an N credit for cash crop yields.
- Tillage can increase N release from cover residue but has drawbacks.
Cash crop protein is often higher after legume covers than fallow.
Acknowledgements
Most of the Montana research presented here was funded by the Montana Fertilizer Advisory Committee, USDA-NRCS Conservation Innovation Grant (Montana), USDA National Institute of Food and Agriculture Hatch grant no. MONB00351/ project accession no. 185726, and Western Sustainable Agriculture and Research Education (SW11-099). We are grateful to collaborating farmers Carl Vander Molen, Herb Oehlke, Chad and Eric Doheny, Chris Larson, Roger Benjamin, Jim Bjelland, and Will Roehm; and Mac Burgess, Justin O’Dea, Meg Housman, Kristi D’Agati, Jeff Holmes, Terry Rick, and Jane Holzer (formerly Montana Salinity Control Association) for field and laboratory labor and expertise. We appreciate the time and expertise of the following for review and production of this bulletin: Kari Lewis (MSU Extension agent), Luke Ahlman (Certified Crop Adviser), Carl Vander Molen (Producer), and MSU Communications.
References
1. Chen, C., J. Huang, and R. Afshar. 2017. Starter N Fertilizer and Rhizobia Inoculant Effects on Dry Pea. Montana Fertilizer eFacts, No. 73. Montana State University Extension. 2pp. http://landresources.montana.edu/fertilizerfacts/index.html
2. Izard, E.J. 2007. Seeking sustainability for organic cropping systems in the northern Great Plains: Legume green manure management strategies. MS Thesis, Montana State University. 127 pp. https://scholarworks.montana.edu/xmlui/handle/1/1541
3. Allen, B.L., J.L. Pikul Jr., J.T. Waddell, and V.L. Cochran. 2011. Long-term lentil green-manure replacement for fallow in the semiarid northern Great Plains. Agron. J. 103:1292-1298. https://doi.org/10.2134/agronj2010.0410
4. Miller, P., C. Jones, C. Zabinski, J. Norton, S. Tallman, andM. Housman. 2016. Using cover crop mixtures to improve soil health in low rainfall areas of the northern plains. Final Report. 40 pp. https://projects.sare.org/sare_project/sw11-099/
5. Burgess, M.H. 2012. Sustainable cropping systems for the northern Great Plains: Energetic and economic considerations. PhD Diss. Montana State Univ., Bozeman. 246 pp. https://scholarworks.montana.edu/xmlui/handle/1/1017
6. Staricka, J. 2019. Cover Crops and Snow Capture. North Dakota State University Williston Research Extension Center report. https://www.ag.ndsu.edu/WillistonREC/archive/dryland-research-1/cover-crops-and-snow-capture
7. Burgess, M., P. Miller, C. Jones, and A. Bekkerman. 2014. Tillage of cover crops affects soil water, nitrogen, and wheat yield components. Agron. J. 106:1497–508. https://doi.org/10.2134/agronj14.0007
8. Miller, P. Unpublished data
9. O’Dea, J., P. Miller, and C. Jones. 2013. Greening summer fallow with legume green manures: On-farm assessment in north- central Montana. J. Soil Water Cons. 68:270-282. https://doi.org/10.2489/jswc.68.4.270
10. Zentner, R., C. Campbell, V. Biederbeck, F. Selles, R. Lemke,P. Jefferson, and Y. Gan. 2004. Long-term assessment of management of an annual legume green manure crop for fallow replacement in the Brown soil zone. Can. J. Plant Sci. 84:11-22. https://doi.org/10.4141/P02-188
11. Chen, C., K. Neill, M. Burgess, and A. Bekkerman. 2012.Agronomic benefit and economic potential of introducingfall-seeded pea and lentil into conventional wheat-based crop rotations. Agron. J. 104:215–224. https://doi.org/10.2134/agronj2011.0126
12. Tallman, S. 2014. Cover Crop Mixtures as Partial Summerfallow Replacement in the Semi-arid Northern Great Plains.MS Thesis. Montana State University. 147 pp. https://scholarworks.montana.edu/xmlui/handle/1/3388
13. Housman, M. 2016. Multi-species cover crops in the northern Great Plains: An ecological perspective on biodiversity and soil health. MS Thesis, Montana State University. 161 pp. https://scholarworks.montana.edu/xmlui/handle/1/9834
14. Miller, P., C. Jones, C. Zabinski, and J. Holmes. 2018. Mixed Cover Crop and Nitrogen Rate Effects on Wheat Yieldand Protein after 6 Years. Montana Fertilizer eFacts, No.76. Montana State University Extension. 3 pp. http://landresources.montana.edu/fertilizerfacts/index.html
15. Miller, P. Personal observation
16. Campbell, C.A., R.P. Zentner, F. Selles, V. Biederbeck, and Leyshon. 1992. Comparative effects of grain Ientil-wheat and monoculture wheat on crop production, N economy and Nfertility in a Brown Chernozem. Can. J. Plant Sci. 72:1091-1107. https://doi.org/10.4141/cjps92-135
17. Schoenau, J., and C. Campbell. 1996. Impact of crop residues on nutrient availability in conservation tillage systems. Can. J. Plant Sci. 76:621-626. https://doi.org/10.4141/cjps96-111
18. O’Dea, J., C. Jones, C. Zabinski, P. Miller, and I. Keren. 2015. Legume, cropping intensity, and N-fertilization effects on soil attributes and processes from an eight-year-old semiarid wheatsystem. Nutr. Cycle. Agroecosys. 102:179-194. https://doi.org/10.4141/cjps96-111
19. Grant, C., J. O’Donovan, R. Blackshaw, K.N. Harker, E. Johnson, Y. Gan, G. Lafond, W. May, T.K. Turkington, N. Lupwayi, D. McLaren, B. Zebarth, M. Khakbazan, M. St. Luce, and R. Ramnarine. 2016. Residual effects of preceding crops and nitrogen fertilizer on yield and crop and soil N dynamics of spring wheat and canola in varying environments on the Canadian prairies. Field Crops Res. 192:86-102. http://dx.doi.org/10.1016/j.fcr.2016.04.019
20. Walley, F., G. Clayton, P. Miller, P. Carr, and G.P. Lafond. 2007. Nitrogen economy of pulse crop production in the northern Great Plains. Agron. J. 99:1710-1718. https://doi.org/10.2134/agronj2006.0314s
21. Rick, T., C. Jones, P. Miller, and J. Holmes. 2015. Effect of Nitrogen Rate and Crop Rotation on Apparent Nitrogen Fertilizer Recovery in Long-term Cropping Systems. Montana Fertilizer eFacts, No. 69. Montana State University Extension. 3 pp. http://landresources.montana.edu/fertilizerfacts/index.html
22. Zentner, R., C. Campbell, F. Selles, P. Jefferson, R. Lemke, B. McConkey, M. Fernandez, C. Hamel, Y. Gan, and A. Thomas. 2006. Effect of fallow frequency, flexible rotations, legume green manure, and wheat class on the economics of wheat production in the Brown soil zone. Can. J. Plant Sci. 86:413-423. https://doi.org/10.4141/P05-081
23. Jones, C., R. Engel, and K. Olson-Rutz. 2019. Soil acidification in the semiarid regions of North America’s Great Plains. Crops & Soils. March-April. 5 pp. https://doi.org/10.2134/cs2019.52.0211
24. Miller, P., J. Holmes, R. Engel, A. Bekkerman, C. Jones, andS. Ewing. 2017. Long-term Profitability of Pea-wheat Systems, Managed at High and Low N Fertility. Montana Fertilizer eFacts, No. 72. Montana State University Extension. 3pp. http://landresources.montana.edu/fertilizerfacts/index.html
25. Miller P.R., A. Bekkerman, C.A. Jones, M.A. Burgess, J.A. Holmes, and R.E. Engel. 2015. Pea in rotation with wheat reduced uncertainty of economic returns in southwest Montana. Agron. J. 107:541-550. https://doi.org/10.2134/agronj14.0185
Resources
Montana State University Extension publications are available online at https://store.msuextension.org/ or call 406-994-3273.
Cover Crops as Partial Replacement of Dryland Fallow (MT202111AG)
Cover Crops: Management for Organic Matter and Nitrogen (EB0236)
Cover Crops: Soil Health (EB0238)
Fertilizer Guidelines for Montana Crops (EB0161)
Interpretation of Soil Test Reports for Agriculture (MT200702AG)
Eastern Ag Research Center Dryland Cool and Warm Season Cover Crop Performance Evaluations. 2016 Agricultural Research Update http://agresearch.montana.edu/earc/annualreports.html
Evaluation of Multiple Species for Use as Cover Crops in Dryland Production in Montana. 2017. McVay et al. http://www.sarc.montana.edu/PHP/Library/presentations/
Montana Data on Cover Crops. 2016. A presentation by Kent McVay, Southern Ag. Research Center. http://www.sarc.montana.edu/php/Library/presentations/?id=26
USDA-NRCS Soil Erosion Enhancement Activity – SQL12- Intensive cover cropping in annual crops. Montana Supplement. Provides seeding rates for cover crop species. https://www.nrcs.usda.gov/Internet/FSE_DOCUMENTS/stelprdb1242878.pdf
USDA-NRCS Bridger Plant Materials Center Technical Notes https://www.nrcs.usda.gov/wps/portal/nrcs/main/plantmaterials/pmc/west/mtpmc/
MT-96. Peas: An Introduced Legume for Conservation Use in Montana and Wyoming. 2014. Hybner, R. 6p. (ID# 12101)
MT-106. Radish: An Introduced Cover Crop for Use in Montana and Wyoming. 2015. Hybner, R. 6p. (ID# 12456)
MT-120. Small-seeded Fava Bean as a Cash Crop and within Cover Crop Mixture. 2017. Tallman, S. 2p. (ID# 13262)
Cover Crop Chart. USDA-ARS Northern Great Plains Research Lab. A decision aid tool with information on 58 crop species https://www.ars.usda.gov/plains-area/mandan-nd/ngprl/docs/cover-crop-chart/

