

Soil pH and Organic Matter
Soil pH and organic matter are key soil parameters. This Nutrient Management Module explains how each affects soil fertility. The appendix at the end of this bulletin lists additional resources.
Last Updated: 03/17by Ann McCauley, Soil Scientist; Clain Jones, MSU Extension Soil Fertility Specialist; and Kathrin Olson-Rutz, Research Associate
Objectives
- After reading this module, the reader should:
- Know what soil pH is and how it relates to soil acidity
- Understand how soil pH affects nutrient availability in the soil
- Learn techniques for managing soil pH
- Know the soil organic matter cycle
- Understand the role of soil organic matter in nutrient and soil organic carbon management
Background
As noted in Nutrient Management Modules 2 to 7, soil pH and organic matter strongly affect soil functions and plant nutrient availability. Specifically, pH influences solubility and availability of plant nutrients, performance of pesticides (which include herbicides), and organic matter decomposition. Although surface soil (approximately the top 4 to 6 inches) pH is generally similar in Montana and Wyoming (pH 6.5-8.0), it can range from 4.5 to 8.5, causing considerable fertility and production challenges at these extremes. Therefore, to understand nutrient availability and optimal growing conditions for specific crops, it is important to understand factors that affect soil pH, and the effects of pH on nutrient availability.
Soil organic matter (SOM) serves multiple functions in the soil, including nutrient retention, water holding capacity, and soil aggregation and is a key indicator of soil quality. Soil organic matter levels have declined over the last century in some soils as a result of over-grazing grasslands and the conversion of grasslands to tilled farmland. This reduction has decreased soil fertility, increased fertilization needs, and increased soil erosion in some areas. Conversely, with more recropping and no-till in recent years, SOM is recovering in other areas. Although SOM decomposition produces carbon dioxide (CO2) and methane, all defined as greenhouse gasses, agricultural land can serve as a net sink for carbon dioxide (carbon sequestration).
Soil pH
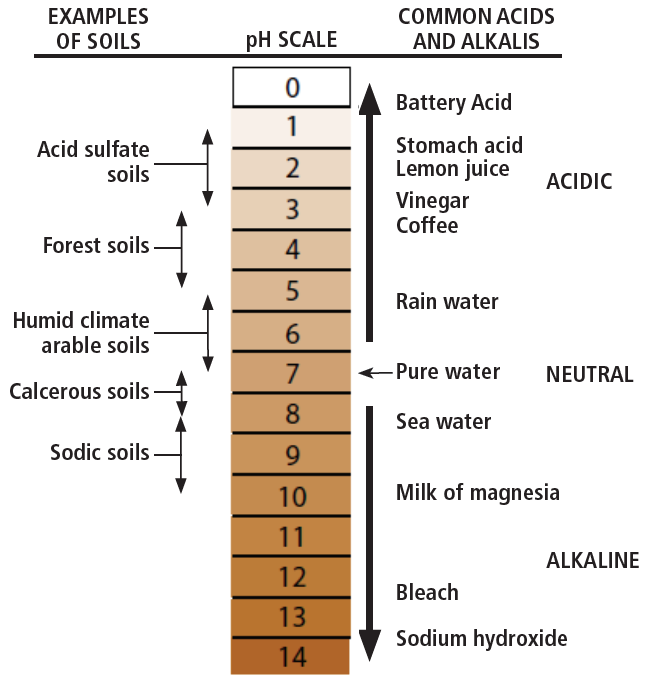
Soil pH is determined by the concentration of hydrogen ions (H+). It is a measure of the soil solution’s (soil water together with its dissolved substances) acidity and alkalinity, on a scale from 0 to 14 (Figure 1). Acidic solutions have a pH less than 7, while basic or alkaline solutions have a pH greater than 7. By definition, pH is measured on a negative logarithmic scale of the hydrogen ion concentration [H+], i.e., pH = -log [H+]. Therefore, as hydrogen ion concentration (and acidity) goes up, pH value goes down. Also, because pH is a logarithmic function, each unit on the pH scale is 10 times more acidic than the unit above it. For example, a pH 6 solution has a 10 times greater concentration of H+ ions than a pH 7 solution, and a 100 times higher concentration than a pH 8 solution.
Soil pH is influenced by both acid and baseforming cations (positively charged dissolved ions) in the soil. Common acid-forming cations are hydrogen (H+), aluminum (Al3+), and iron (Fe2+ or Fe3+), whereas common base-forming cations include calcium (Ca2+), magnesium (Mg2+), potassium (K+) and sodium (Na+).
FIGURE 1. The pH scale (1).
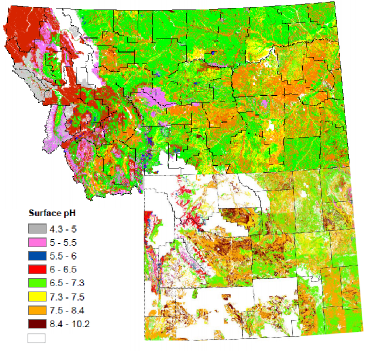
Most agricultural soils in Montana and Wyoming have near-neutral to basic conditions with average pH values of 6.5 to 8 (Figure 2). This is primarily due to the presence of base-forming cations associated with carbonates and bicarbonates found naturally in soils and irrigation waters. Due to relatively low precipitation amounts, there is little leaching of base-forming cations, resulting in pH values greater than 7.
There some areas in Montana and Wyoming with acidic soils. Acidic conditions occur in soil with parent material high in elements such as silica (rhyolite and granite), high levels of sand with low buffering capacities (ability to resist pH change), and in regions with higher amounts of precipitation. High precipitation causes leaching of base-forming cations and lowering of soil pH. Naturally acidic soils are most commonly found west of the continental divide or in high elevation areas, in areas where soils were formed from acid forming parent material, forest soils, mining sites containing pyritic (iron and elemental sulfur [SO]) minerals, and a few other isolated locations. Soil acidity in the seeding zone is becoming a problem on some cropland soils because of N fertilization. The number of soil samples in Montana with pH less than 6.5 has increased 4-fold from 1995 to 2015 (2).
Nutrient Availability
A soil’s ability to hold and supply nutrients is related to its cation and anion exchange capacities, the number of parking spaces for nutrients on soil particles. Cation and anion exchange capacities are influenced by soil pH. As described in Plant Nutrition and Soil Fertility, cation and anion exchange capacity are largely determined by the charge of the soil particles and SOM. Soils with high amounts of clay and/or organic matter typically have higher cation exchange capacity (CEC), that is, are able to bind more cations such as calcium or potassium than more silty or sandy soils. They also have greater buffering capacity.
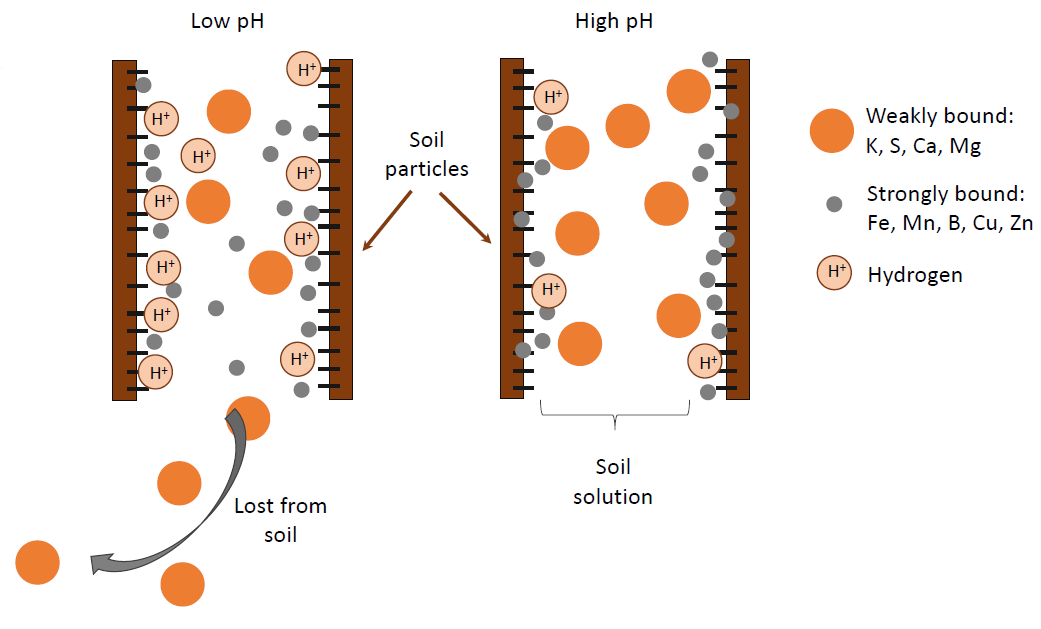
Soil pH affects nutrient availability because the H+ ions take up space on the negative charges along the soil surface (Figure 3), displacing nutrients. The effect on nutrient availability depends on the size and charge of the nutrient molecules and whether or not they can be lost to leaching.
The metal nutrients (e.g., copper [Cu], iron, manganese [Mn], zinc [Zn]) are small molecules when dissolved in water with 2 to 3 positive charges, thus a high charge to size ratio. They bind strongly to the surface of soil particles. At high pH (i.e., basic, low H+ concentration), these metal ions stick so tightly they are not readily found in soil solution and thus are less available for plant uptake. At low pH (i.e., acidic, high H+ concentration), fewer can stick to the soil surface, making them more available for plant uptake.
Sulfur (S) and the base-forming cations (Ca2+, Mg2+, K+, and Na+) are relatively large molecules. Like a large electrostatically charged balloon does not stick well to a wall, these large molecules do not stick tightly to soil particles. Therefore, even at high pH (low H+ concentration), they easily come off of the soil particle and enter soil solution. At low pH they are displaced by H+, and may not be plant available because they have been lost from the soil through leaching or uptake. Nitrate (NO3-) is equally available across soil pH levels because it doesn’t bond much to soil.
In general, nitrogen (N), potassium, calcium, magnesium and sulfur are more available within soil pH 6.5 to 8, while boron (B), copper, iron, manganese, nickel (Ni), and zinc are more available within soil pH 5 to 7. At pH less than 5.5, high concentrations of H+, aluminum and manganese in soil solution can reach toxic levels and limit crop production (3, 4). Phosphorus is most available within soil pH 5.5 to 7.5.
FIGURE 2. Soil surface horizon pH (generally 4 to 6-inch depth) in Montana and Wyoming. Map courtesy Natural Resources Conservation Service, Montana and Wyoming state offices.
Agronomic Concerns
In addition to the effects of pH on nutrient availability, and aluminum and manganese toxicity, individual plants and soil organisms also vary in their tolerance to basic and/or acid soil conditions. Neutral conditions appear to be best for crop growth. However, optimum pH conditions for individual crops vary (Table 1). Some crop varieties are being developed to tolerate lower pH and higher aluminum levels.
TABLE 1. Optimal pH ranges for common crops in Montana and Wyoming (5).
| Crop | Soil pH |
| Alfalfa | 6.2 - 7.5 |
| Barley | 5.5 - 7.0 |
| Dry bean | 6.0 - 7.5 |
| Corn | 5.5 - 7.0 |
| Oat | 5.5 - 7.0 |
| Pea | 6.0 - 7.0 |
| Potato | 5.0 - 5.5 |
| Sugar beet | 6.5 - 8.0 |
Soil microorganism activity is greatest near neutral conditions, but optimal pH ranges vary for each type of microorganism. Microbial activity is considerably reduced at pH 5 and below (6). Moreover, certain ‘specialized’ microorganisms, such as nitrifying bacteria (convert ammonium [NH4+] to nitrate [NO3-]) and nitrogen-fixing bacteria associated with many legumes, generally perform poorly when soil pH falls below 6 (7). For example, alfalfa (a legume) grows best in soils with pH levels greater than 6.2, conditions in which its associated nitrogen-fixing bacteria grow well too. Potatoes grow well at soil pH 6.5, but the potato scab organism also thrives at that pH. Scab is greatly reduced at pH less than 5.2, which potatoes tolerate, but production requires higher fertilization to compensate for reduced nutrient availability at such low pH (8). In contrast, fungi generally thrive at low pH, so fungal diseases are more common in acidic soils. Finally, pesticide effectiveness and residual (carry-over) is an issue in acidic soils (9, Washington). When soil pH is extremely acidic or basic, pH modifications may be needed to obtain optimal growing conditions for specific crops.
Managing Soil pH
To manage soil pH, the addition of amendments, fertilization and tillage practices, SOM levels and crop selection should all be considered (Table 2). The longevity of soil pH change brought about by management greatly depends on the treatment. Changes can occur within a season or last for decades.
FIGURE 3. Potassium, sulfur, calcium and magnesium are more available at higher pH, the micronutrients are more available at lower pH.
Amendments
Sulfur
A common amendment used to lower the pH of basic soils is sulfur (10). Elemental sulfur is oxidized by microbes to produce sulfate (SO42-) and H+, causing a lower pH. Ferrous sulfate (FeSO4) and aluminum sulfate (Al2[SO4]3) can also be used to lower pH, not due to sulfate (see Q&A #1), but because of the addition of acidic cations (Fe2+, Al3+). Application rates for these amendments vary depending upon product properties (particle size, oxidation rate) and soil conditions (original pH, buffering capacity, minerals present). Because calcium carbonate (CaCO3) consistently buffers soil to pH values near 8, soils high in calcium carbonate would need larger quantities of sulfur amendments to lower pH than generally economical. An unpublished study by Agvise Laboratories, Inc., found 230 lb S/1,000 ft2 (5 ton/acre) reduced soil pH from 8.0 to 7.5, and 115 lb gypsum/1,000 ft2 (2.5 ton/acre) had no impact on soil pH. At $1 per pound sulfur, amending with sulfur might be worthwhile for a market garden, but certainly not for large scale crop production.
Lime
A common method for increasing soil pH is to lime soils with calcium carbonate, calcium oxide (CaO), calcium hydroxide (Ca[OH]2), or calcium containing by-products such as sugar-beet lime. The liming material reacts with carbon dioxide and water in the soil to yield bicarbonate (HCO3-) and hydroxide (OH-), which take H+ and aluminum (acid-forming cations) out of solution, thereby raising the soil pH. The benefits are varied and depend on the soil pH level reached (Table 3).
Companies supplying lime amendments are required to state the lime score (which is also called effective neutralizing value [ENV]), calcium carbonate equivalent (CCE), and particle size on their label. Lime score is a quality index used to express the effectiveness of liming materials for neutralizing soil acidity and is based on purity, particle size, and percent dry matter. Chemical purity is represented by CCE which compares the liming material to pure calcium carbonate. As CCE increases, the acid neutralizing power in the lime increases. Particle size is measured as the mesh size (number of screen wires per inch) through which ground lime will fall; increasing mesh size corresponds with smaller mesh openings. Fine sized lime (mesh size of 40 or greater) will react more effectively and quickly in the soil, whereas coarser sized lime will dissolve more slowly and remain in the soil for a longer period of time. Many commercial liming products are a mixture of particle sizes to provide both a rapid increase in pH and continued neutralizing action over a few years’ time. See Acid Soils: Management for details on liming and the appendix for further resources.
Q&A #1
Gypsum (CaSO4) wasn’t mentioned as an amendment to lower pH, yet it is often added to basic soils. Why?
The sulfur in gypsum (and ferrous sulfate and aluminum sulfate) is already oxidized and will not react to form acidifying ions, so it does not lower soil pH. Rather, gypsum is added to sodic soils (high in sodium [Na+]), which often have pH levels greater than 8.5. Sodium causes soils to disperse, reducing soil water- holding capacity and aeration. The Ca2+ in gypsum replaces Na+ from exchange sites, causing Na+ to be easily leached from the soil and lowering pH to < 8.3.
TABLE 2. Management practices that change soil pH.
| Decrease | Increase |
| Elemental sulfur | Lime |
| Ammonium based nitrogen fertilizer (e.g., urea, 11-52-0) | Nitrate based nitrogen fertilizer (e.g., ammonium nitrate [34-0-0]) |
| Leaf and stem harvest | Large quantity plant material left on field |
| Legumes on soil surface | Legumes in mature root zone |
| SOM to buffer | |
| Tillage to mix layers | |
TABLE 3. The benefits of increasing pH of acidic soilsa.
| Soil pH change | Effects |
| 6.1 -› 6.5 | Improve soil structure, reduce crusting, and reduce power need for tillage |
5.6 -› 6.0 |
Increase soil microbial activity; increase rhizobia health for nitrogen-fixation and other mycorrhizal assisted crops (legumes and barley); increase plant nutrient availability; as above |
| 5.1 -› 5.5 | Reduce aluminum, H+, and manganese toxicity; as above |
| < 5.1 | Few crops can produce if not limed |
a Source: 11
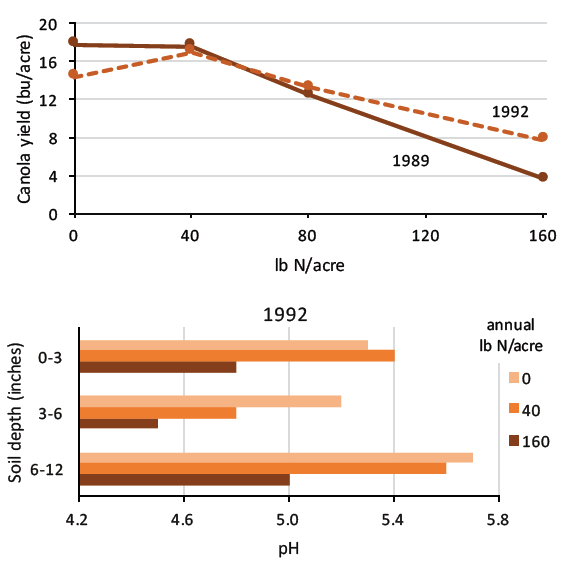
FIGURE 4. Annual applications of excess urea for 9 years (1983 to 1992) decreased canola yield and soil pH, and increased aluminum and manganese to potentially toxic levels. The suggested nitrogen rate was 40 lb N/acre (16, 17, both Saskatchewan).
Fertilizer
Nitrate-based nitrogen fertilizers, such as calcium nitrate (15.5-0-0 +19% Ca) may increase soil pH at both the surface and deeper levels but only if the nitrate gets taken up by the plant and is not lost to leaching (12, 13, both Australia). In contrast, ammonium-based fertilizers, such as urea (46-0-0) and ammonium phosphates (11-52-0 or 18-46-0) can slowly lower pH of basic soils, yet in some areas of Montana and the inland Pacific Northwest have led to excessive acidification of the seeding zone and decreased yields. Soils in northern Montana declined from soil pH 6.2 to 5.6 in 10 years (14) and in Idaho and eastern Washington from near neutral to pH less than 6 in about 25 years (15).
Nitrogen fertilizer acidification, and concomitant H+, aluminum and manganese toxicity, is more severe with nitrogen application rates in excess of crop requirement, especially in the seeding zone (Figure 4). Considering the cost of lime to offset soil acidification induced by nitrogen fertilizer, the economically optimal nitrogen level was as much as 11.3 percent lower than the yield maximizing level when lime cost was considered (18, Australia). To minimize soil acidification due to nitrogen fertilizer, use practices that prevent excess nitrogen application, encourage uptake of all applied nitrogen, and reduce nitrate leaching (Table 4).
TABLE 4. Steps to minimize soil acidification due to fertilizer nitrogen.
| 1. Increase efficiency of nitrogen use |
|
- Base nitrogen rate on spring soil test and realistic yeildpotentiala - Split nitrogen applications |
| Reduce nitrate lossb |
|
- Use slow-release nitrogen sourcesc - Use nitrogen sources with nitrification inhibitorsc - Plant deep rooted crops to ‘catch’ deep nitrate |
| 3. Consider non-ammonium based nitrogen sources |
| - Legume rotations |
| - Calcium ammonium nitrate (27-0-0) |
a Developing Fertilizer Recommendations for Agriculture
b Crop and Fertilizer Management Practices to Minimize Leaching
c Enhanced Efficiency Fertilizers
Organic material
Soil organic matter is the combination of plant and animal residues at various stages of decomposition and cells and tissues of soil organisms (19; Q&A #2). The consistent benefit of SOM is that it buffers soil pH change. Soil organic matter offers many negatively charged sites to bind H+ in an acidic soil, or from which to release H+ in a basic soil, in both cases pushing soil solution towards neutral. Whether SOM changes soil pH in the long term depends on many factors (Table 5, Q&A #3).
When organic matter first begins to decay, it releases anions and cations. Plant foliage and stems generally contain more anions, so the initial decay over the first few weeks causes a soil pH increase. This initial increase in soil pH, especially from high nitrogen plant residue, could be used to reduce H+, aluminum or manganese toxicity in the seedling rooting zone long enough for seedling establishment (21, laboratory). Soil microbes further break down the plant material to ammonium (mineralization) which temporarily increases pH. The ammonium gets converted to nitrate (nitrification) which causes pH to instead go down. If the nitrate is lost to leaching, pH drops even more. In the very long term, microbial decomposition decreases pH.
The net effect of organic matter addition on soil pH depends on the rate at which all these processes occur and what happens with the nitrogen produced (e.g., nitrate plant uptake vs. leaching loss), the quality and quantity of plant material, and initial soil pH. Soil pH will likely increase with decomposition of plants growing on basic soils, and manure derived from such plants, deep rooted plants that draw anions from deep soil layers to the soil surface, and, plant residue high in nitrogen (e.g., from field pea; 22, 23, both Australia). Higher residue amounts increase soil pH (24, Australia).
Tillage
Tillage does not consistently increase or decrease soil pH (25, multiple locations). The top few inches of no-till soils can become more acidic due to nitrogen fertilization in that zone (14, Montana). Occasional tillage mixes the acidic layer with higher pH sub-surface layers, or helps integrate lime treatment. A soil with 5 percent calcium carbonate, typical in Montana, contains around 100 tons of calcium carbonate in the top foot. This is enough to offset at least a century worth of acid forming nitrogen fertilizer if it could be tilled up into the acidic zone. However, tillage reduces SOM, therefore the soil’s ability to resist change in soil pH.
Q&A #2
What is the difference between organic material and soil organic matter?
Organic material is plant or animal residue that has not undergone decomposition, as tissue and structure are still intact and visually recognizable. Soil organic matter is organic material that has undergone decomposition and humification (process of transforming and converting organic residues to humus). Soil organic matter is commonly defined as the amount of organic material that will pass through a 2-mm sieve (19).
Crop selection
Crops vary in their ability to raise or lower soil pH. For example, harvest of high yielding leafy crops such as forage or corn can reduce soil pH because leaves and stems contain large amounts of base-forming cations (Ca2+, K+, Mg2+). A grain harvest with plant residue left behind removes much smaller amounts of these elements. For example, oat straw requires 6 times the lime to counter the acidifying effect of its removal, than oat grain harvest, and alfalfa harvest requires 10 times the lime as oat grain harvest (26,
Nebraska). However, removing residue is not a desirable practice to lower soil pH. The benefit of SOM from
crop residue outweighs the potential soil acidification by residue removal.
Legumes acidify their rooting zone through nitrogen-fixation. The acidifying potential of annual legumes (pea<lentil<chickpea) is lower than that of perennial legumes (alfalfa<clover; 24, Australia).
Q&A #3
How much residue does it take to change soil pH?
Based on Australian research, 1.7 ton/acre residue in the top 1 inch can change soil pH by 0.02 units (24). Montana State University cover crop trials produced about this much residue in 1 rotation (20, Montana). So, 5 rotations of a cover crop could theoretically increase soil pH by 0.1 unit in the top 1 inch of soil. To impact soil pH to 4-inch depth could take 4 times as long or 4 times as much residue. Increasing plant residue by itself is not a quick, effective way to change soil pH. However plant residue becomes SOM which has many benefits.
TABLE 5. The processes and conditions that influence whether organic matter increases or decreases soil pH.
| Increase pH | Decrease pH |
| Microbial decomposition of carbohydrates | |
| Mineralization to ammonium | Nitrification to nitrate |
| Volatilization loss of ammonia gas | Leaching loss of nitrate |
| High plant residue base-forming cation content | Low plant residue base-forming cation content |
| Large amount of residue | Small amount of residue |
| Soil pH < SOM pH | Soil pH > SOM pH |
Planting deep-rooted crops (e.g., safflower, sunflower, and winter wheat) helps prevent nitrate from leaching, thereby reducing soil acidification. Deep rooted crops can also pull base-forming cations from the subsurface to the surface. Acid and aluminum tolerant crops can be used to minimize nitrate leaching and add biomass to slow acidification while waiting for lime treatment to take effect.
Testing Soil pH
Soil pH is measured to assess potential nutrient deficiencies, crop suitability, pH amendment needs, and to determine proper testing methods for other soil nutrients, such as phosphorus. Handheld pH sampling meters are now available that provide quick, reliable results from soil cores to determine soil pH at 1-inch or less increments. The process is not difficult, but the equipment does need regular cleaning, calibration and proper storage. Field testing with meters or ‘color’ kits can indicate whether alkalinity or acidity may be an issue and help select which soils to send to a laboratory. Field tests do not provide enough information to determine lime or sulfur requirements; laboratory buffer tests are necessary for lime or sulfate rate calculations.
Buffer tests tend to be regionally specific to account for a region’s unique soil conditions. The Woodruff, SMS, Sikora, Mehlich or modified Mehlich tests are suitable for Montana soils (27). It is important to be aware of pH meters and buffer tests used and be consistent to ensure comparable data over time. Soil testing laboratories usually note test methods used on the soil test report. Also, pH varies seasonally, for example, a soil under wheat varied from pH 6.2 in early April, to 6.5 in mid- June, to 5.5 in mid-October (28, Saskatchewan). Annual comparisons should be made from samples taken the same time of year.
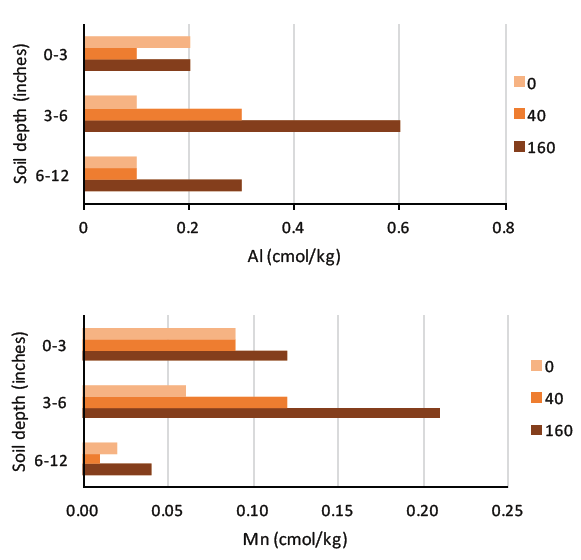
Soils sampled for laboratory pH analysis should be 1 foot deep and divided into 0 to 3, 3 to 6, 6 to 9, and 9 to 12-inch depth increments. It is important to properly sample incremental depths because a given pH zone can exist in only a narrow depth increment, for example, the top 3 inches due to surface broadcast nitrogen fertilizer. Sampling over a 6 or 12-inch depth could seriously underestimate a soil pH decline in the critical seeding zone (0 to 3-inch depth; 29, North Dakota). Sampling only the top 3 inches would not allow one to determine if and how deep to plow to mix deep, higher pH soils with low pH surface soils.
Soil cores should be at least ¾-inch diameter and a composite of 6 to10 subsamples should be mixed and subsampled before sending in about a 2-fist size sample. Remove plant residue or duff on the soil surface before taking the soil sample core. Samples should be kept cold or frozen until delivered. Detailed soil sampling methods and laboratory selection are described in Soil Sampling and Laboratory Selection.
Soil Organic Matter
Organic Matter Cycling
Though living organisms are not considered within the technical definition of SOM, their presence is critical to the formation of SOM. Plant roots and fauna (e.g., rodents, earthworms, mites, and microorganisms) all contribute to the movement and breakdown of organic material in the soil.
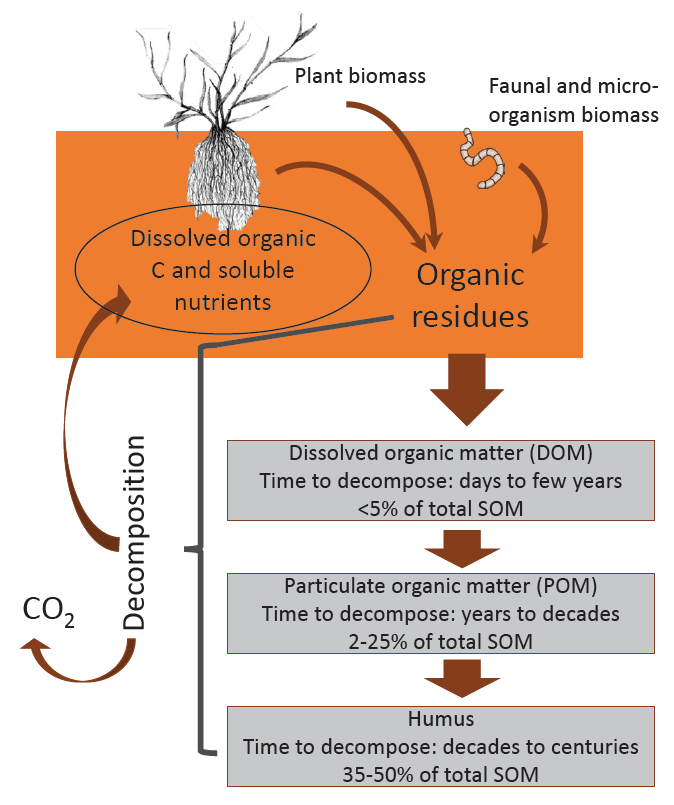
As organic residues decompose, organic carbon and nutrients are either released for plant uptake or transferred to a more stable SOM pool (Figure 5). This process produces carbon dioxide through microbial respiration and chemical oxidation, which is eventually released to the air.
The three main pools of SOM, determined by their time for complete decomposition, are dissolved organic matter (DOM, 1-2 years), particulate organic matter (POM, 15-100 years) and humus (500-5,000 years; 19). Both DOM and POM are biologically active, meaning they are continually being decomposed by microorganisms, thereby releasing many organically-bound nutrients, such as nitrogen, phosphorus, and other essential nutrients, back to the soil solution. Dissolved organic matter is primarily composed of soluble portions of fresh plant and animal residues. That which is not completely decomposed moves into the POM pool, consisting primarily of detritus (cells and tissues of decomposed material). Particulate organic matter is partially resistant to microbial decomposition and serves as an important long-term supply of nutrients (30).
In contrast to DOM and POM, humus is not biologically active and is the pool responsible for many of the soil chemical and physical properties associated with SOM and soil quality. Representing approximately 35 to 50 percent of total SOM, humus is a dark, complex mixture of organic substances modified from original organic tissue, synthesized by various soil organisms, and resistant to further microbial decomposition (31). Because of this, humus breaks down very slowly and may exist in soil for hundreds or even thousands of years. Due to its chemical make-up and reactivity, humus is a large contributor to a soil’s ability to retain nutrients on exchange sites. Humus also supplies organic chemicals to the soil solution that can serve as chelates and increase metal availability to plants (see Micronutrients: Cycling, Testing and Fertilizer Recommendations and discussed below). Additionally, organic chemicals have been shown to minimize the binding of phosphate with calcium (creating an insoluble mineral), possibly keeping fertilizer phosphorus in soluble form for a longer period (32). Dissolved organic chemicals act to ‘glue’ soil particles together, enhancing aggregation and increasing overall soil aeration, water infiltration and retention, and resistance to erosion and crusting. Soils high in humus are dark brown or black, increasing the amount of solar radiation absorbed by the soil and thus, soil temperature.
FIGURE 5. Organic matter decomposition cycle.
SOM Decomposition and Accumulation
Soil organic matter content depends on the balance between organic residue addition and the rate of decomposition. Good growing conditions, crops or cover crops rather than fallow, and leaving plant residue on the field all add organic matter. Soil organic matter decomposition rates depend on SOM form, soil texture and drainage, carbon:nitrogen ratios of organic materials, climate, and cropping practices. Neither excess buildup (peat), nor rapid decomposition are ideal. Once a portion of SOM decomposes, its benefits to soil aeration, and nutrient and water holding capacity are decreased, and carbon is lost from the system as carbon dioxide gas.
As previously noted, SOM forms (i.e., DOM, POM, or humus) accumulate and decompose at different rates. For example, DOM and POM levels can fluctuate relatively quickly with changes in land management practices, particularly the adoption of no-till systems and recropping. Research has shown DOM and POM levels to increase in no-till systems compared to conventional till systems (33, 30), yet levels may decline following a return to tillage or under certain climatic conditions (discussed below). Humus content, on the other hand, is much more constant. Since SOM tests do not differentiate between SOM forms, changing DOM and POM levels can cause fluctuations to occur in total SOM levels, even though humus content remains the same.
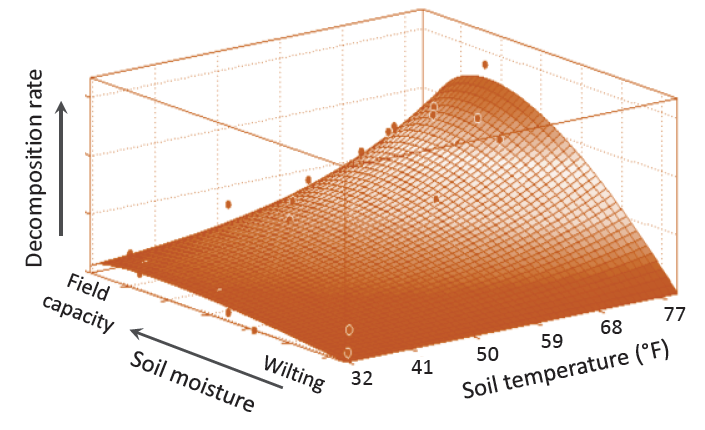
FIGURE 6. SOM decomposition increases as the combination of temperature and soil moisture increases within conditions favorable for most microbial growth. The dots are measured values (34, Massachusetts).
Soils high in clay and silt are generally higher in SOM content than sandy soils. This is attributed to restricted aeration in finer- textured soils, reducing the rate of organic matter oxidation, and the binding of humus to clay particles, further protecting it from decomposition. Additionally, plant growth is usually greater in fine-textured soils, resulting in a larger return of residues to the soil.
Poorly-drained soils typically accumulate higher levels of SOM than well-drained soils. This is due to poor aeration causing a decline in soil oxygen concentrations. Many soil microorganisms involved in decomposition are aerobic (oxygen-requiring) and will not function well under anaerobic conditions (oxygen- limiting). This anaerobic effect is evident in wetland areas in which the ‘soil’ is often completely composed of organic material.
The carbon:nitrogen ratio of organic material affects microorganism activity and subsequent decomposition rates. Organic materials with carbon:nitrogen ratios greater than 30:1 (e.g., cereal grain straw at 80:1) generally decompose slowly and tend to accumulate, whereas those with carbon:nitrogen less than 24:1 (e.g., pea cover crop) decompose quickly. To obtain a desired balance between SOM decomposition and accumulation, different crops can be planted in rotation or organic materials can be mixed (see Nitrogen Cycling, Testing, and Fertilizer Recommendations for carbon:nitrogen ratios of various materials).
Climate impacts decomposition and accumulation by affecting growth conditions for soil microorganisms. A combination of warm and moist soil is ideal for decomposition and rapid release of nutrients (Figure 6). Decomposition can be faster at higher temperatures, but adequate soil moisture becomes critical. At very low temperatures, decomposition is limited by both temperature and water availability, such as in cold deserts, and in arid and semi-arid portions of the northern Great Plains.
Cultivated land generally contains lower levels of SOM than comparable lands under natural vegetation. Prairie soils of the northern Great Plains originally had at least 4 percent SOM, whereas present day SOM content in most Montana and Wyoming agricultural topsoil ranges from 1.5 to 4 percent. In cultivated areas, only plant material remaining after harvest and not burned makes it back to the soil. Increasing crop residue by reducing fallow and appropriate fertilization helps increase SOM (Figure 7; 33, Oregon; 36). In contrast, tillage reduces SOM in the plow layer because: a) it aerates the soil and breaks up organic residues, thus stimulating microbial activity and increasing SOM decomposition, b) decreases soil water, which decreases production, and, c) increases susceptibility to soil wind and water erosion. Minimizing tillage helps build SOM in the surface soil of our region, but planting cover crops with abundant fibrous roots (e.g., grass) instead of fallow, will likely do more to increase deep SOM than reducing tillage.
Chelation
As introduced in Micronutrients: Cycling, Testing, and Fertilizer Recommendations, many organic substances can serve as chelates for micronutrient metals. Chelates (meaning ‘claw’) are soluble organic compounds that bind metals such as copper, iron, manganese, and zinc, and increase their solubility and availability to plants (5, 37). The dynamics of chelation are illustrated in Figure 8. A primary role of chelates is to keep metal cations in solution so they can diffuse through the soil to the root. This is accomplished by the chelate forming a ‘ring’ around the metal cation that protects the metal from reacting with other inorganic compounds (19). Upon reaching the plant root, the metal cation either ‘unhooks’ itself from the chelate and diffuses into the root membrane or the entire metal-chelate complex is absorbed into the root, and then breaks apart, releasing the metal. Both cases can result in the metal being taken up by the root and the chelate returning to the soil solution to bind other metals.
Chelation may be particularly important for regions with basic soils. As previously noted, metal availability is often inhibited under basic soil conditions, causing plant micronutrient deficiencies. Iron, for instance, becomes nearly insoluble as soil pH nears 8 and chelation can greatly increase availability (up to 100-fold; 5). Chelation can be increased through the use of commercial chelating agents, synthetic organic compounds such as ethylenediaminetetraacetic acid (EDTA), or by maintaining and increasing SOM levels.
FIGURE 7. SOM after 10 years of cropping and tillage treatment. F - fallow, W - wheat, Pea harvested for grain, as forage or killed early bloom as cover crop, CRP - Conservation Reserve Program = alfalfa- grass. Bars that have none of the same letters are different with 95% confidence (35, Montana).
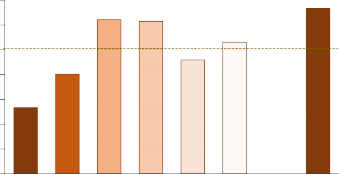
FIGURE 8. Cycling of chelated iron (Fe2+) in soils.
Carbon Sequestration
Carbon cycling is the transfer of both organic and inorganic carbon between the pools of the atmosphere (carbon dioxide and methane), terrestrial and aquatic organisms (living plants, animals, microorganisms), and the soil. Research within the last few decades indicates carbon concentrations in the atmosphere have increased with inputs linked to industrial emissions (i.e., extraction and combustion of fossil fuels) and land use changes (e.g., cutting and burning large areas of forest). This increase is causing the carbon balance between pools to shift and is contributing to global climate change. In response, the United States Department of Agriculture (USDA) along with other national and international organizations is promoting management practices to conserve and sequester (store) carbon (see appendix for resources). The goal of carbon sequestration is to reduce atmospheric carbon concentrations by taking carbon dioxide out of the atmosphere and storing it in ‘sinks’ such as soil. Increased carbon sequestration and changes in soil water dynamics following the reduction of fallow in the northern Great Plains since the 1970s coincides with a reduction in summertime temperatures across parts of this region (38, Canadian Prairies).
An important sink within soil is SOM, in which organic carbon (vs. inorganic, such as bicarbonate) levels are over twice as large as the atmosphere carbon dioxide pool and 4.5 times larger than the carbon pool in land plants (39). Soil carbon sequestration is accomplished through soil conservation practices that not only reduce soil erosion, but also increase the SOM content of soils. Possible conservation strategies which sequester carbon include converting marginal crop lands to perennial native systems (i.e., wildlife habitat) or rangelands, practicing no- till or conservation-till farming, reducing the frequency of summer fallow in crop rotation, and incorporating, rather than disposing of organic amendments such as manure (40).
Producers can use the Natural Resources Conservation Service’s (NRCS) COMNET-VR online tool to input management practices (e.g., residue management, cropping sequence, and tillage system) to estimate changes in soil carbon sequestration over time. The NRCS provides free technical assistance to develop and evaluate management practices. See the appendix for resources.
SOM Testing
Soil organic matter levels are used to calculate nitrogen fertilizer rates, estimate a soil’s water holding capacity and nutrient availability, and determine effects of agronomic practices on SOM over time. To sample for SOM, core the top 6 inches of soil. Organic material on the surface (i.e., duff or visible plant parts) should be excluded, as it is not part of SOM and can produce invalid readings. Soil testing laboratories return results as a SOM percentage. In interpreting SOM tests, it is important to understand what is being tested for and the test method used. Most SOM values are derived from organic carbon which represents approximately 50 percent of SOM, so a conversion factor of 1.7 to 2 is often used to estimate SOM concentrations (e.g., SOM = 1.7 x organic carbon). Common methods for testing SOM are Walkley-Black acid digestion and weight loss on ignition (LOI). Both of these methods test for total SOM and do not distinguish between different SOM forms, e.g., DOM, POM or humus. Therefore, two soils may have similar SOM contents, yet SOM function may differ considerably between the two soils. For example, one soil may have high humus, thus high mineral nutrient availability, yet be slow in releasing nitrogen, whereas a soil high in DOM could provide high nitrogen (e.g., from legume residue) but supply minimal micronutrients. Laboratory tests for SOM are not highly precise or reliable (41). For meaningful comparison of SOM over time or space, test results should come from the same laboratory.
Summary
Soil pH is a measure of a soil solution’s acidity and alkalinity that affects nutrient solubility and availability in the soil. Factors influencing soil pH include organic matter decomposition, nitrogen fertilizer source, weathering of minerals and parent material, climate, and land management practices. Availability of nutrients for plant uptake varies depending on soil pH. The availability of cation nutrients is often hindered by decreased solubility in highly basic soils and increased susceptibility to leaching or erosion losses in acidic soils. For anion nutrients, availability is generally the opposite. Soil pH levels near 7 are optimal for overall nutrient availability, crop tolerance, and soil microorganism activity. Soil pH can be modified by using chemical amendments; however these treatments may only be effective for a relatively short amount of time and are generally not economically viable.
Soil organic matter is an essential component of soil, contributing to soil biological, chemical, and physical properties. Soil organic matter exists in three forms in the soil, each with different amounts and rates of SOM decomposition and nutrient mineralization. In addition to nutrient storage, SOM aids nutrient availability by increasing the soil’s CEC, providing chelates, and increasing the solubility of certain nutrients in the soil solution. Furthermore, the humus fraction of SOM improves soil structure by increasing soil water-holding capacity, infiltration, and aeration. By incorporating SOM conservation into management plans, farmers and producers sequester atmospheric carbon and benefit from an overall increase in soil quality and possibly lower input costs.
References
- Nutrient Manager. 1996. Focus on pH and Lime. Nutrient Manager Vol 3, No. 2. University of Maryland Extension. https://extension.umd.edu/sites/default/files/_images/programs/anmp/pH_newsltr.pdf
- Agvise Laboratories. Unpublished data. Northwood, North Dakota.
- Brown, T.T., R.T. Koenig, D.R. Huggins,J.B. Harsh, and R.E. Rossi. 2008. Lime effects on soil acidity, crop yield, and aluminum chemistry in direct-seeded cropping systems. Soil Science Society of America Journal. 72:634-640. doi:10.2136/sssaj2007.0061
- Kidd, P.S., and J. Proctor. 2001. Why plants grow poorly on very acidic soils: are ecologists missing the obvious? Journal of Experimental Botany. 52:791-799. doi:10.1093/ jexbot/52.357
- Havlin, J.L., J.D. Beaton, S.L. Tisdale, and W.L. Nelson. 1999. Soil Fertility and Fertilizers, 6th Edition. Prentice-Hall, Inc., Upper Saddle River, New Jersey. 499 p.
- Rousk, J., P.C. Brookes, and E. Bååth. 2009. Contrasting soil pH effects on fungal and bacterial growth suggest functional redundancy in carbon mineralization. Applied & Environmental Microbiology. 75:1589- 1596. doi:10.1128/AEM.02775-08
- Munns, D.N. 1986. Acid soil tolerance in legumes and rhizobia. Advances in Plant Nutrition. 2:63-91.
- Loria, R. 1991. Potato Scab. http://vegetablemdonline.ppath.cornell.edu/factsheets/Potato_Scab.htm
- Reader, A.J., D.L. Lyon, J.H. Harsh, and I. Burke. 2015. How Soil pH Affects the Activity and Persistence of Herbicides. Washington State University Extension Bulletin FS189E. http://pubs.wpdev.cahnrs.wsu.edu/pubs/fs189e/
- Slaton, N.A., R.J. Norman, and J.T. Gilmour. 2001. Oxidation rates of commercial elemental sulfur products to an alkaline silt loam from Arkansas. Soil Science Societyof America Journal. 65:239-243. doi:10.2136/sssaj2001.651239x
- Alberta Agriculture & Forestry. 2002. http://www1.agric.gov.ab.ca/$department/deptdocs.nsf/all/agdex3684#the
- Jarvis, S.C., and A.D. Robson. 1983. The effects of nitrogen nutrition of plants on the development of acidity in Western Australian soils. II. Effects of differences in cation/anion balance between plant species grown under non-leaching conditions. Australian Journal of Agricultural Research. 34:355-365. doi:10.1071/AR9830355
- Conyers, M.K., C. Tang, and G.J. Poile. 2011. A combination of biological activity and the nitrate form of nitrogen can be used toameliorate subsurface soil acidity under dryland wheat farming. Plant and Soil. 348:155-166. doi:10.1007/s11104-011-0827-6
- Aase, J.K., and J.L. Pikul, Jr. 1995. Crop and soil response to long term tillage practices in the northern Great Plains. Agronomy Journal. 87:652-656. doi:10.2134/agronj1995.000 21962008700040008x
- Mahler, R.L., A.R. Halvorson, and F.E.Koehler. 1985. Long-term acidification of farmland in northern Idaho and eastern Washington. Communications in Soil Science and Plant Analysis. 16:83-95. doi:10.1080/00103628509367589
- Bouman, O.T., D. Curtin, C.A. Campbell, V.O. Biederbeck, and H. Ukrainetz. 1995. Soil acidification from long-term use of anhydrous ammonia and urea. Soil Science Society of America Journal. 59:1488-1494. doi:10.2136/ sssaj1995.03615995005900050039x
- Campbell, C.A., V.O. Biederbeck, H. Ukrainetz, D. Curtin, and T. Bouman. 1994. Effects of long-term use of urea and anydrous ammonia on crop yields and soil characteristics. Transactions 15th World Congress of Soil Science, Acapulco, Mexico. July 1994. p. 704-713.
- Tumusiime, E., B.W. Brorsen, J. Mosali, and J.T. Biermacher. 2011. How much does considering the cost of lime affect the recommended level of nitrogen? Agronomy Journal. 103:404-412. doi:10.2134/ agronj2010.0355
- Brady, N.C., and R.R. Weil. 1999. The Nature and Properties of Soils. 12th Edition. Prentice-Hall, Inc., Upper Saddle River, New Jersey. 881 p.
- Housman, M. 2016. Multi-Species Cover Crops in the Northern Great Plains: An Ecological Perspective on Biodiversity and Soil Health. M.S. Thesis, Montana State University, Bozeman, Montana.
- Xiao, K., L. Yu, and J. Xu. 2014. pH, nitrogen mineralization, and KCl-extractable aluminumas affected by initial soil pH and rate of vetch residue application: results from a laboratory study. Journal of Soils and Sediments. 14:1513-1525. doi:10.1007/s11368-014-0909-1
- Butterly, C.R., J.A. Baldock, and C. Tang. 2013. The contribution of crop residues to changes in soil pH under field conditions. Plant and Soil. 366:185-198. doi:10.1007/ s11104-012-1422-1
- Pocknee, S., and M.E. Sumner. 1997. Cation and nitrogen contents of organic matter determine its soil liming potential. Soil Science Society of America Journal. 61:86-92. doi:10.2136/ sssaj1997.03615995006100010014x
- Paul, K.I., A.S. Black, and M.K. Conyers. 2003. Development of acidic subsurface layers of soil under various management systems. Advances in Agronomy. 78:187 -214. doi. org/10.1016/S0065-2113(02)78005-X
- Busari, A.B., S.S. Kukal, A. Kaur, R. Bhatt, and A.A. Dulazi. 2015. Conservation tillage impacts on soil, crop and the environment. International Soil and Water Conservation Research. 3:119-129. doi:10.1016/j. iswcr.2015.05.002
- Wortman, C.S., M. Mamo, and C.A. Shapiro. 2009. Management Strategies to Reduce the Rate of Soil Acidification. University of Nebraska Extension. NebGuide G1503. http://extensionpublications.unl.edu/assets/html/g1503/build/g1503.htm
- Thompson, W.H., C. McFarland, and T. Brown. 2016. Agricultural Lime and Liming Part 2: Laboratory Testing to Determine Lime Requirements. Washington State University Fact Sheet http://pubs.wpdev.cahnrs.wsu.edu/pubs/fs217e/
- Campbell, C.A., and R.P. Zentner. 1984. Effect of fertilizer on soil-pH after 17 years of continuous cropping in southweste