

Micronutrients: Cycling, Testing and Fertilizer Recommendations
This module is the seventh in a series of Extension materials designed to provide Extension agents, Certified Crop Advisers (CCAs), consultants, and producers with pertinent information on nutrient management issues. To make the learning ‘active,’ and to provide credits to CCAs, a quiz accompanies this module. In addition, realizing that there are many other good information sources, including previously developed Extension materials, books, Web sites, and professionals in the field, we have provided a list of additional resources and contacts for those wanting more in-depth information about micronutrients. This module covers the following Rocky Mountain CCA Nutrient Management Competency Areas with the focus on micronutrients: Basic concepts of soil fertility, soil test reports and fertilizer recommendations, and fertilizer forms and application.
Last Updated: 05/09by Clain Jones, Extension Soil Fertility Specialist; and Jeff Jacobsen, College of Agriculture Dean
Objectives
After reading this module, the reader should:
- Know the names of the eight micronutrients
- Understand the major nutrient cycling processes that determine the availability of micronutrients in soil
- Know the factors that affect each of these cycling processes
- Understand how to diagnose and correct micronutrient deficiencies
- Understand how to calculate micronutrient fertilizer requirements
Background
Micronutrients are essential to plant growth, yet are required in much smaller amounts than macronutrients (Nutrient Management Modules 3-6). The eight micronutrients are: boron (B), chloride (Cl), copper (Cu), iron (Fe), manganese (Mn), molybdenum (Mo), nickel (Ni), and zinc (Zn). The importance of each micronutrient for plant growth wasoutlined in Nutrient Management Module2. Micronutrients are usually not added in fertilizer mixes in Montana and Wyoming due to generally sufficient micronutrient availability in soils of this region. However, there are documented cases in Montana and Wyoming of B, Cl, Cu, Fe, Mn, and Zn deficiencies. In addition, because there is only a finite source of these micronutrients in soil, it is expected that micronutrient deficiencies will become more common with time, especially if organic matter continues to decline, no manure is applied, and a majority of the plant is harvested and removed.
Table 1. Typical total and available concentrations of essential metals in soil.
| Metal | Average total soil concentration (ppm)* |
Average Montana soil test concentration, 0-6 inches (ppm) ** |
| Copper | 30 | 2.0 |
| Iron | 38,000 | 15.8 |
| Manganese | 600 | 12.4 |
| Nickel | 40 | *** |
| Zinc | 50 | 1.2 |
* Lindsay (1979).
** Haby and Sims (1979) based on 301 producer samples. Soil test metals (DTPA) are designed to estimate plant-available metal concentrations.
*** Nickel was not determined to be essential until 1987 (Havlin et al., 1999) and is generally not tested in soils.
Five of the micronutrients (Cu, Fe, Mn, Ni, and Zn) are metals, and are primarily positively charged ions (cations) in soil water. Metals tend to behave similarly in soil, and will be discussed first. The other three micronutrients (B, Cl, Mo) exist either as neutral or negatively charged molecules in soil water (referred to here as ‘anion micronutrients’), and will be discussed after metals.
Micronutrient Cycling
Metal Cycling
Metals exist in one of four forms in the soil: mineral, organic, sorbed (bound to soil), or dissolved. The majority of metals in soil are bound in minerals and organic matter (OM), and are unavailable to plants. Sorbed metals represent the third largest pool, and are generally very tightly bound to soil surfaces. Although mineral, organic, and sorbed metals are not immediately plant available, they can slowly release metals into solution. Dissolved metal concentrations are usually very low, especially at soil pH levels typical for Montana and Wyoming.
The concentration of plant available metals can be estimated with an organic extractant such as DTPA. The total concentrations of metals in soil (determined by extracting with strong acids) are generally orders of magnitude higher than plant available metals (Table 1). Most notably, the available Fe concentration represents less than 0.1% of the average total Fe concentration in soils.
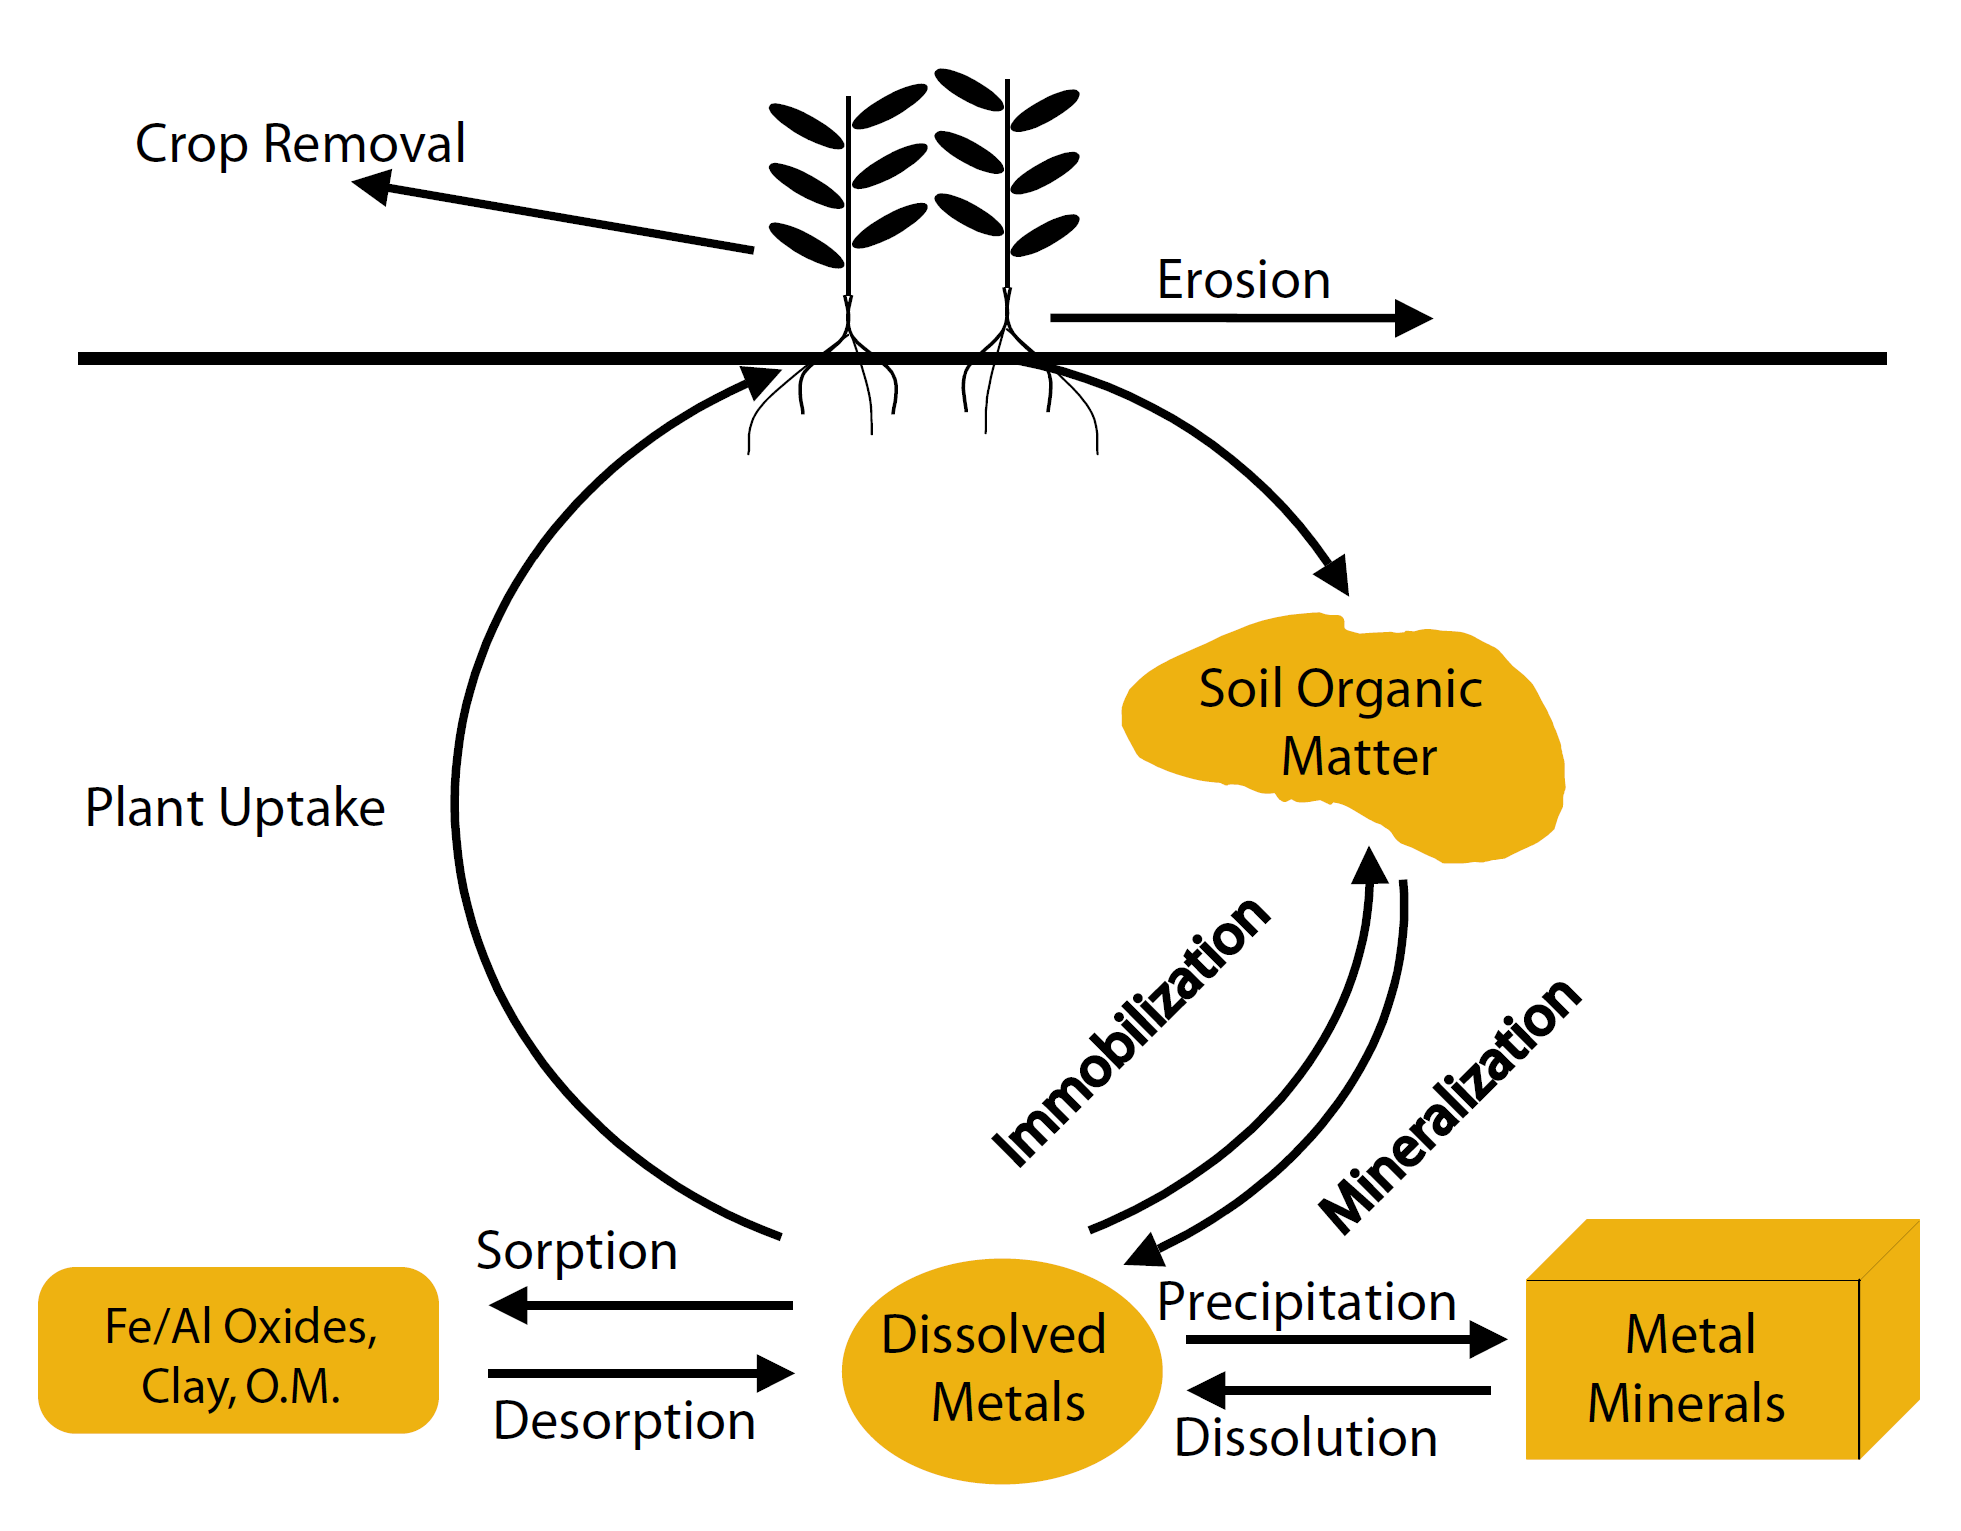
The processes that determine the amount of metals available in solution are: plant uptake, sorption/desorption, precipitation/dissolution, mineralization/immobilization, erosion, and crop removal (Figure 1).
Plant uptake
Plants take up metals as cations (positively charged dissolved ions). Typical amounts of crop uptake range from less than 0.1 lb/ac for Ni and Cu to 0.5 lb/ac for Fe, although these amounts are highly crop dependent. Concentrations of the essential metals in plants range from approximately 0.5 ppm for Ni to 100 ppm for Fe in dry plant tissue, with considerable variability based on plant species. By comparison, N concentrations in dry plant tissue are approximately 10,000 to 50,000 ppm. Even though metals are needed in substantially smaller concentrations than N, they are absolutely as necessary for proper plant functioning and growth. Absorption of metals by plants is partially dependent on the concentrations of other nutrients. For example, high concentrations of Cu, Mn, Mo, Ni, or Zn have been found to cause Fe deficiencies (Havlin et al., 1999). In addition, plants fertilized with NO3- have a higher chance of causing Fe deficiencies than plants fertilized with NH4+ due to pH differences in the root zone.
Figure 1. Metal micronutrient cycle.
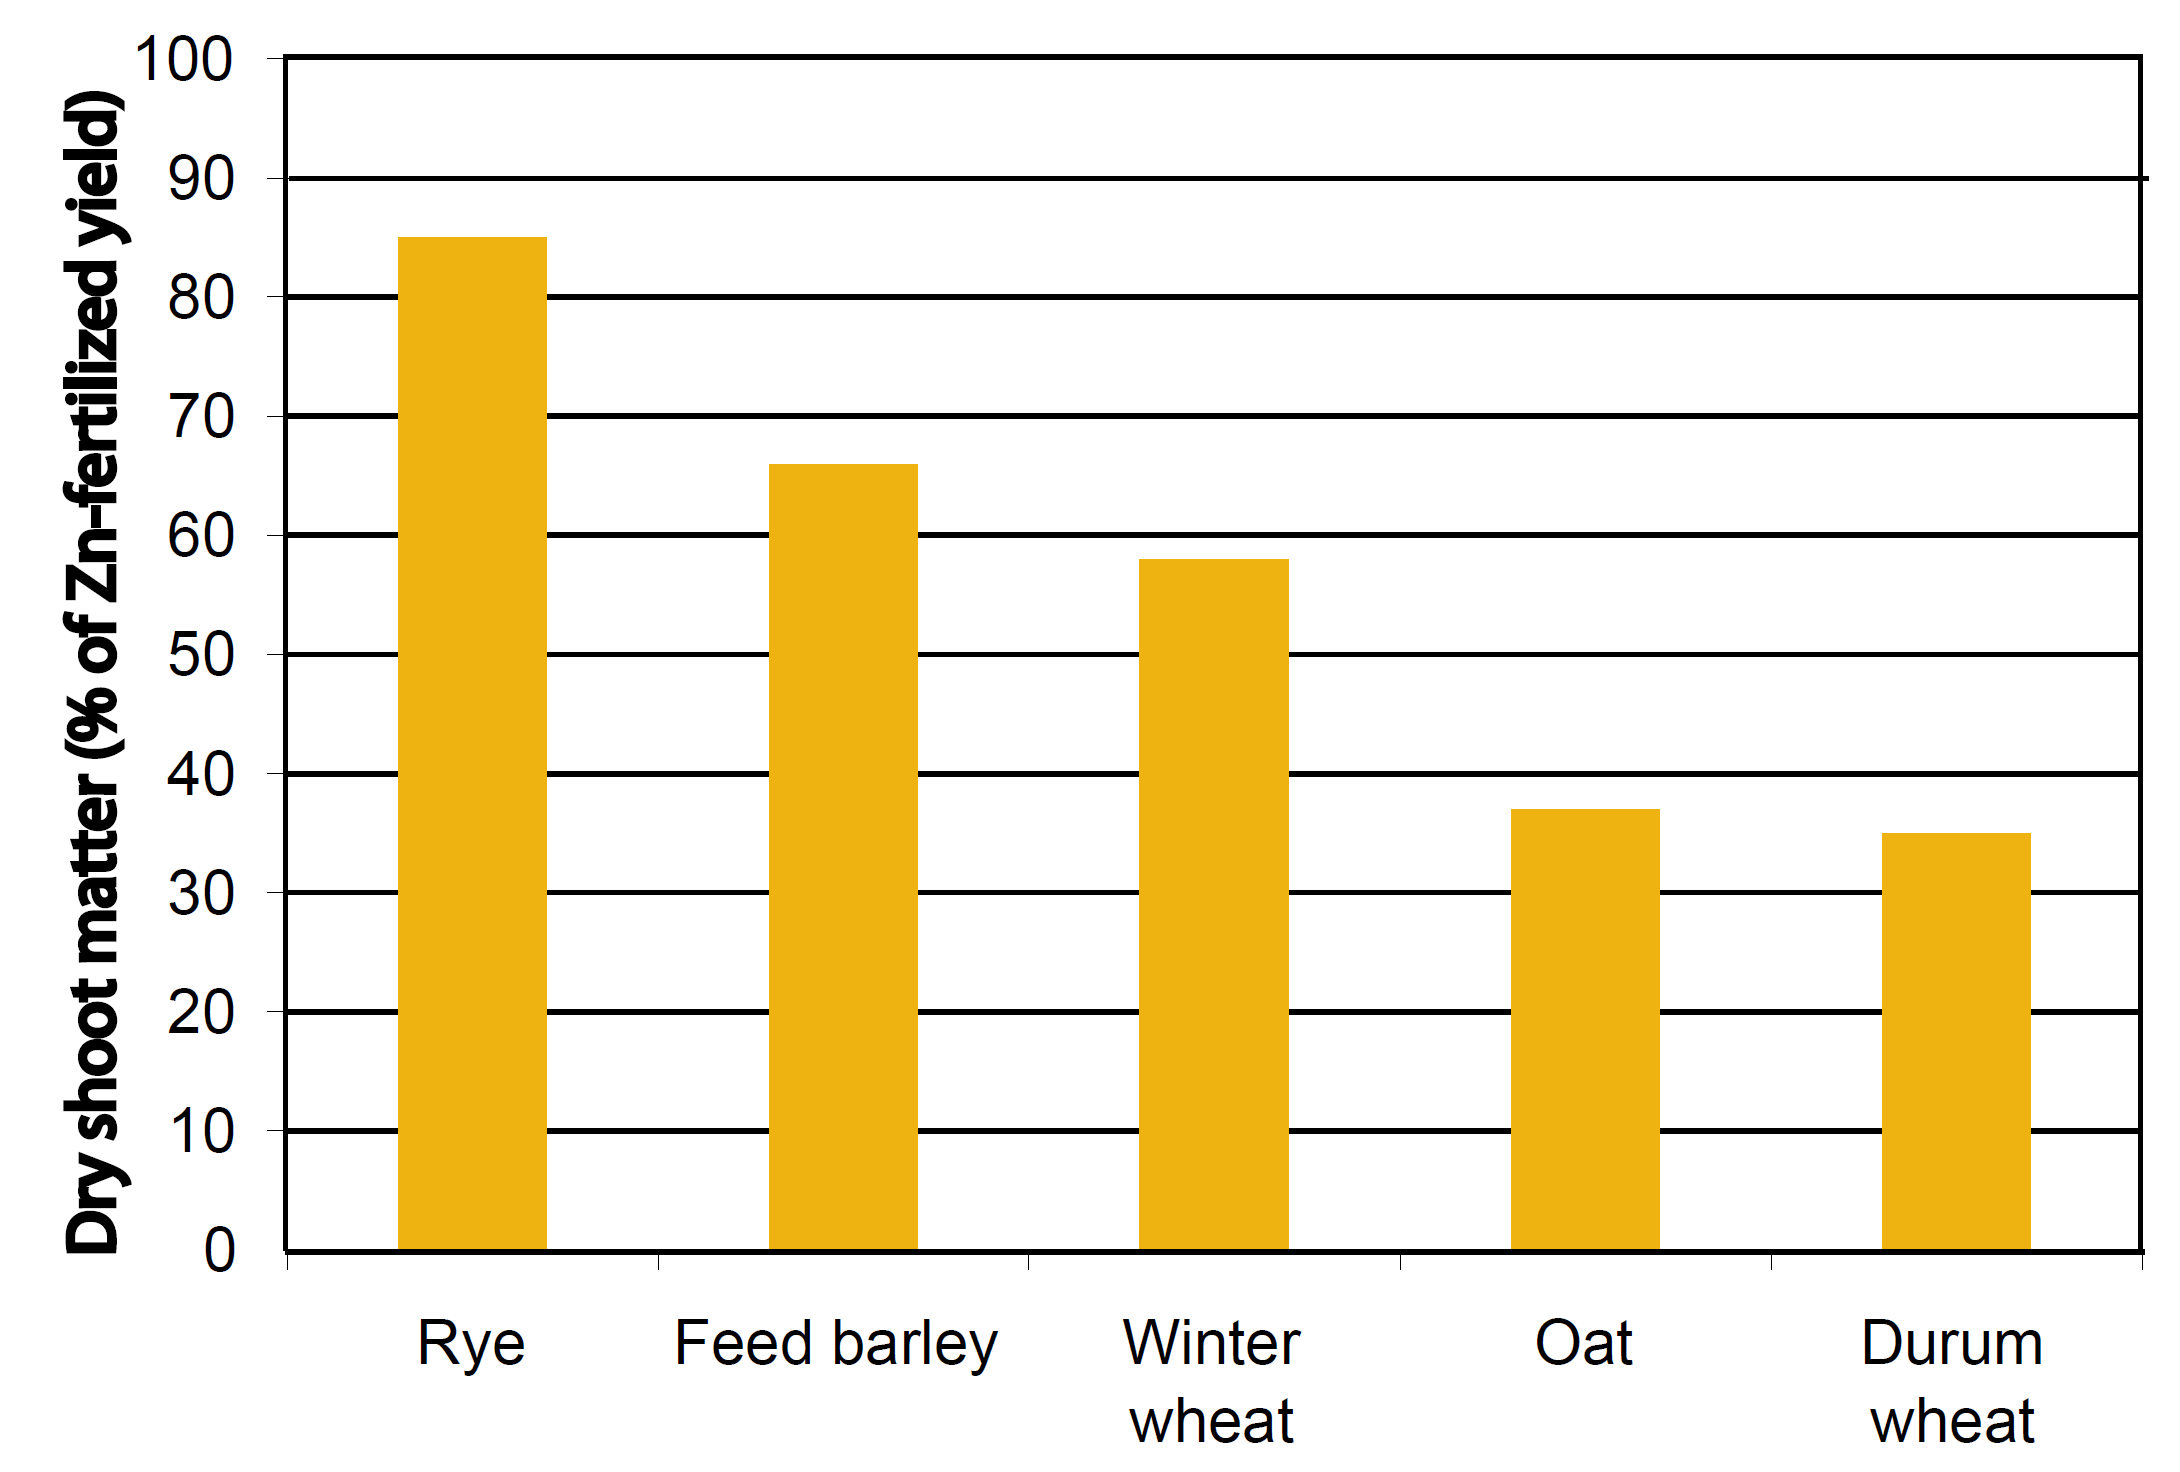
Uptake of metals varies considerably between crops, and even among cultivars of the same crop. For example, rye takes up approximately 40% less Zn than winter wheat in a Zn-deficient soil, yet takes up approximately 60% more Zn than winter wheat in the same soil that has been fertilized with Zn (Cakmak et al., 1998). Of five small grains, durum wheat apparently is the most impacted by Zn deficiency based on comparing shoot dry matter production from a calcareous, Zn deficient soil with the same soil fertilized with Zn (Figure 2). Within three varieties of winter wheat, average decreases in dry shoot biomass due to Zn deficiency ranged from 34% to 51%, demonstrating that not all wheat cultivars are created equal with respect to Zn (Cakmak et al., 1998).
Figure 2. Sensitivity to low soil Zn (expressed as Zn-deficient dry shoot matter/Zn-fertilized dry shoot matter x 100%) (Cakmak et al., 1998).
A similar study on 13 alfalfa varieties found that plants grown on Zn deficient soils had dry shoot biomasses that were 68 to 85% lower than when these same soils were fertilized with Zn (Grewal and Williams, 1999). The combined results show that Zn uptake and sensitivity to Zn- deficient soils are very dependent on both crop and cultivar.
Dissolved metal concentrations in soil with very low amounts of OM can be lower than necessary for adequate plant growth, demonstrating the importance of OM in promoting metal micronutrient availability and uptake (Havlin et al., 1999). Why does OM help increase the solubility and plant uptake of metals? ‘Chelation’ is the process where a dissolved organic substance, or ‘chelate’ (meaning “claw-like”), binds with a metal cation to form a soluble metal-organic complex. This results in increased desorption or dissolution of the metal cation (Nutrient Management Module 8 describes this process in more detail). Specifically, chelation can increase the soluble concentration of Fe by more than 100 fold, otherwise there would be insufficient Fe available for plant uptake at pH levels near 8 (Havlin et al., 1999). Examples of ‘chelates’ are humates and fulvates. Both are found naturally in most soils because they are byproducts of OM decomposition. Chelates are also found in root ‘exudates’ (organic substances excreted from roots), which can greatly increase the availability of metals immediately around plant roots. Management practices which increase organic matter, such as no-till or manure applications, can increase the degree of chelation, thereby increasing metal availability.
Metal Sorption/Desorption
Metals sorb strongly because they are generally positively charged, and most soil surfaces (clay, organic matter) are negatively charged. For example, four of the five essential metals are positively charged at pH 7.5 (Fe2+ or Fe3+, Mn2+, Ni2+, and Zn2+). Copper, which exists predominantly as the neutral species Cu(OH) o at pH 7.5 also has two major positively charged forms, Cu2+ and CuOH+, which both sorb strongly to soil surfaces, and thereby decrease soluble Cu concentrations. Metals sorb to clays, organic matter, and hydroxides of Fe, Mn, and aluminum. Metal sorption is directly related to the cation exchange capacity of the soil.
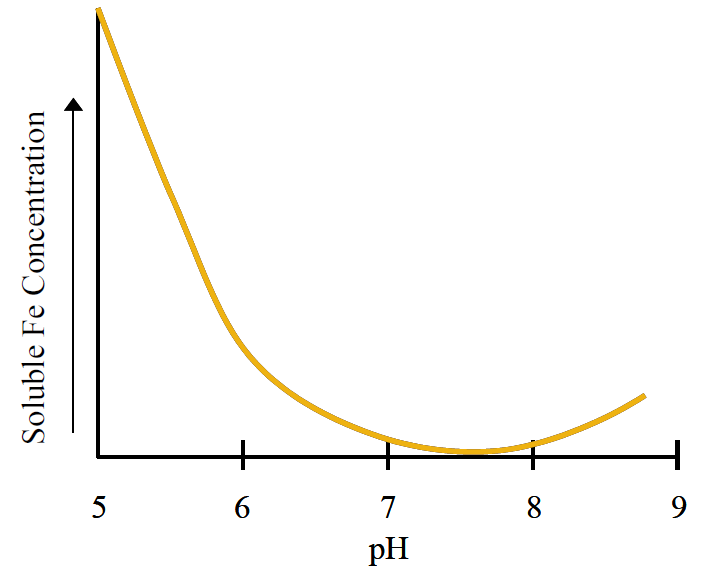
Figure 3. The effect of soil pH on total soluble Fe concentrations. Actual Fe concentrations will depend on the degree of chelation.
As discussed in Nutrient Management Module 2, mineral surfaces become more negatively charged at higher pH making them more likely to attract and sorb metals. Dissolved concentrations of metals are lowest near pH 8 for Fe and pH 9 for Zn due to stronger sorption and less dissolution at high pH, as discussed below. Due to the predominance of soils near pH 8 in Montana and Wyoming, metal micronutrients are likely sorbed strongly to soils in this region.
Metal Precipitation and Dissolution
Metal minerals can slowly dissolve under certain environmental conditions, thereby releasing metals into the soil solution. For example, Fe and Mn hydroxides, which are very common in soil, will dissolve under flooded conditions due to lack of oxygen, and then precipitate under drier conditions. This process causes soils to become ‘mottled’, or layered with red and gray tones. The metal hydroxides all are less soluble as pH increases; therefore, it is less likely that metal deficiencies will occur at low pH levels. Due to the dependence of pH on metal mineral solubility, soluble Fe concentrations can decrease by more than a factor of 100 for each unit increase in pH (i.e., if pH went up from 5 to 6). Total soluble Fe concentrations reach a minimum near pH 7.5 (Figure 3), which is why Fe deficiencies are much more common on high pH soils. As pH continues to increase, metal solubility eventually increases again.
Mineralization and Immobilization
Crop residues, added organic material (such as manure) and soil organisms will break down with time, releasing metals into solution in a process called mineralization (covered in Nutrient Management Module 3). Conversely, microorganisms can take up metals, resulting in immobilization. As discussed in Nutrient Management Modules 3 and 4, the relative amounts of mineralization and immobilization will often depend on the ratios of C to N or C to P in the organic residue. Generally, it’s not believed that micronutrient concentrations will control mineralization rates. Low temperature and low moisture will decrease both mineralization and immobilization, since both factors affect microbial growth rates. Practices that can speed up mineralization rates, such as N fertilization, tillage, irrigation, and applications of manure, would be expected to increase the release of plant-available metals.
Erosion/Leaching
Soil erosion will cause a loss of metal micronutrients from fields because the metals are bound tightly to soil. In addition, metal concentrations are generally higher in the upper horizons than in the lower horizons in Montana, magnifying this effect (Haby and Sims, 1979). Therefore, practices designed to decrease soil erosion will also decrease loss of metals via erosion. Decreasing loss of soil and metals associated with that soil may have the added benefit of improving water quality, which is becoming more of a regulatory and environmental concern, especially with the implementation of Total Maximum Daily Loads (TMDLs). TMDLs will be discussed in Nutrient Management Module 13. Leaching is generally not a concern with metals because they sorb so strongly.
Q&A #1
Why is Cl considered to be a micronutrient when plant tissue generally has 0.1 - 1% Cl, similar to many of the macronutrients?
The distinction between macro and micronutrients lies in the plant needs, not typical plant concentrations. Cl has been found to cause deficiencies only when tissue concentrations fall below 1,000 ppm, or 0.1%, which is below concentrations needed by the macronutrients. The other micronutrients are all needed in smaller amounts than Cl, so in some ways, Cl forms the boundary between micronutrients and macronutrients.
Anion Micronutrient Cycling
The anion micronutrients are boron (B), chloride (Cl), and molybdenum (Mo). Cl and Mo generally exist as anions in soil, whereas B generally exists as a non- charged acid (H3BO o), though it can exist as an anion at higher pH.
The transformations that the anion micronutrients undergo are similar to the metal micronutrients with some major exceptions, largely due to charge differences. For example, Cl and B have a much higher likelihood of leaching than the metals because they are not positively charged, and do not sorb readily to clay particles. In addition, the vast majority of Cl in soil is available for plant uptake. B exists primarily in minerals in soil, yet is relatively more available than the metal micronutrients. Finally, Mo is found primarily in minerals or is sorbed strongly to soil surfaces. The factors that affect mineralization, immobilization, and erosion of these anion micronutrients are the same as those discussed above for the metal micronutrients.
Plant Uptake
Chloride is absorbed by plants through both roots and leaves. Uptake can be decreased by high concentrations of either NO3- or SO42-, likely due to competition for negatively charged ions at the root surface. Boron uptake is suppressed by high availability of either Ca or K. Low soil moisture also decreases B uptake due to decreased B diffusion and transport to roots. The uptake of Mo is increased by P, NO3-, and Mg, and decreased by Cu, Mn, NH4+, and SO42-. Plant tissue concentrations typically range from less than 1 ppm for Mo, 6 to 60 ppm for B, and 0.1% to 1% for Cl. Lack of Cl has been found to cause tissue necrosis (indicated by leaf spotting) in winter wheat and durum wheat in Montana (Engel et al., 1998; Engel et al., 2001). B [and Mo] deficiencies have been very sporadically documented in this region, primarily in alfalfa.
Anion Sorption/Desorption
Only small amounts of Cl sorb to soil surfaces, causing Cl to be very available and mobile in soil. Therefore, Cl is prone to leaching, especially in areas with heavy precipitation or irrigation. Boron can sorb to the edges of some clays and Fe and Al hydroxides, with maximum sorption occurring near pH 9 (Keren and Bingham, 1985). Therefore, liming soils can cause a temporary B deficiency (Fageria et al., 2002). Because most B exists as a neutral, or non-charged, molecule at pH levels below approximately 9, it is relatively available and mobile at pH levels typical of Montana and Wyoming soils. Molybdenum is the least available of the three anionic micronutrients. It exists in soil solution primarily as MoO42- (molybdate) and has similar characteristics as phosphate (Nutrient Management Module 4), meaning it sorbs strongly to Fe and Al hydroxides. Molybdate desorption increases at higher pH, and combined with the very low Mo requirements of plants (tissue concentrations are near 1 ppm), explains why Mo deficiencies are not common in the generally high pH soils found in Montana and Wyoming.
Anion Precipitation and Dissolution
Although chloride minerals are not very common in soil, mineral chloride can exist in soils as soluble salts such as CaCl2 or MgCl2. Borosilicate minerals are the main B minerals in soils. These minerals dissolve very slowly, especially in the cool, arid regions found in most of Montana and Wyoming. Calcium and lead molybdate are the two minerals believed to control Mo concentrations in soil. The solubility of both minerals is relatively constant below pH 7.7, and then increases quickly above this pH.
Factors Affecting Micronutrient Availability
As discussed above, the five metal micronutrients plus B become less available as pH increases. Molybdenum exhibits the opposite effect, with increased availability at higher pH. Cl availability is independent of pH. Factors other than pH that affect micronutrient availability are discussed below.
Copper
High C:N organic material or residues can cause Cu deficiency due to uptake by microorganisms, sorption, and inhibited root development, likely caused by low available N concentrations. Sandy soils generally have a higher likelihood of Cu deficiency than finer-textured soils.
Iron
Most Fe deficiencies occur on calcareous, high pH soils. In addition, periods of saturation in poorly aerated soils can enhance Fe deficiency, possibly due to reduced nutrient absorption under these conditions. Fe deficiency is also more common on soils low in OM, especially where land leveling has removed the upper organic rich soils and exposed calcareous subsoil. Chelators in OM will increase Fe availability.
Manganese
Addition of OM can increase available Mn, although soils naturally high in OM sometimes show Mn deficiencies. This apparent discrepancy is due to the relative availability of Mn in recently added organic amendments compared to older materials where decomposition has slowed considerably. Dry weather increases Mn deficiency likely due to precipitation of unavailable Mn oxides. Saturated conditions cause some Mn minerals to dissolve and become available to plants.
Nickel
Although little is written about factors affecting Ni availability because it has only recently (1987) been added to the list of essential elements, it can be assumed that the factors affecting the availability of the other metals also affect Ni availability.
Zinc
Organic matter can increase Zn solubility due to chelation and mineralization, but at very high levels, can decrease Zn availability due to sorption and precipitation of organic-Zn solids. For example, Zn deficiency can occur in peat soils due to these second two reactions. High concentrations of available soil P have been found to cause Zn deficiencies in both sugar beets and dry beans in the lower Yellowstone River Valley (Halvorson and Bergman, 1983).
Boron
Applications of OM increase B uptake likely due to both chelation and mineralization. Fine soils retain and release B better than coarse soils. Soils high in K may increase B deficiencies, although the reason for this effect is unknown (Havlin et al., 1999). In addition, drought conditions can increase B deficiencies, likely due to slower diffusion.
Chloride
Cl deficiencies in Montana and Wyoming can be attributed to indigenous soils being very low in Cl levels, little Cl being deposited from the atmosphere, and until recently, limited application of potash (KCl). Cl is also readily leached, and Cl deficiencies have been observed in areas receiving high precipitation during the fall and winter months (Engel et al., 1998). Wheat and durum are the only crops in Montana that have had confirmed Cl deficiencies.
Molybdenum
Soils high in Fe/Al oxid Mo strongly, reducing Mo a Higher levels of phosphate increase Mo availability because P and Mo are so similar that P will compete for the same sorption sites as Mo, resulting in Mo desorption.
Q&A #2
Why did it take scientists so long to determine that Ni was essential for plant growth?
To determine essentiality of an element, scientists need to demonstrate that the full life cycle of a plant cannot be completed without that element.These experiments are generally conducted in water containing the known essential elements, because soil contains many other elements, makingessentiality nearly impossible to prove in soil alone. It’s difficult to completely remove the micronutrients from a nutrient solution due to impurities in these added nutrients and due to the presence of micronutrients in the seed. To dilute the micronutrients in theseed, plants may need to be transplanted and grown for several generations before a micronutrient that is needed in such small amounts is completely excluded from the system, and essentiality verified.
Testing for Micronutrients
How do you know if your field or crop is deficient in one of the micronutrients, and therefore, if micronutrient fertilization would be expected to result in a yield response? Visual symptoms are often used to diagnose nutrient deficiencies as discussed in Nutrient Management Module 9. Often, however, plants may experience ‘hidden hunger’, meaning they are deficient in a nutrient, but show no visual clues. In addition, many of the micronutrient deficiencies look similar, making testing of soil or plant tissue essential for determining if a response to a micronutrient fertilizer is likely or not.
Soil testing for micronutrients
Soil sampling was described in Nutrient Management Module 1. Once the soils are collected, they are delivered to a laboratory for testing. Micronutrient availability in soils is tested with a variety of methods, although some tests have become more standard than others. In Montana, metals are typically measured with diethylenetriaminepetaacetic acid (DTPA), a chelator designed to extract the most readily available metals. Often, DTPA is buffered with triethanolamine (TEA) to maintain a pH near 8, because pH can greatly affect metal solubility as pointed out earlier. Chloride is measured in a water extract, and a hot water extraction is the most typical for B. Currently, there is no reliable soil test for Mo (Havlin et al., 1999), but again, Mo deficiency is generally not a concern in Montana and Wyoming.
Table 2. Micronutrient fertilizer guidelines based on soil analysis.
| Micronutrient | Soil Test* (ppm) | Micronutrient Fertilizer Rate (lb/ac) |
| Boron | 0.0-0.5 0.5-1.0 >1.0 |
2 1 0 |
| Copper | 0.0-0.5 >0.5 |
2 0 |
| Iron | 0.0-2.5 2.5-5.0 >5.0 |
4 2 0 |
| Manganese | 0.0-0.5 0.5-1.0 >1.0 |
20 10 0 |
| Zinc | 0.0-0.25 0.25-0.5 >0.5 |
10 5 0 |
* - Top 6 inches
From Fertilizer Guidelines for Montana Crops, EB 161 (Jacobsen et al., 2005).
Soil test results should be compared with micronutrient fertilizer guidelines for your state. Guidelines for Montana are shown in Table 2. Keep in mind that these are guidelines; decisions on micronutrient fertilization should depend on knowledge of growth responses to micronutrient fertilization in the local area. In addition, as pointed out earlier, fertilizer solubilities and forms may greatly affect the amount of fertilizer needed to produce a growth response.
A survey of 301 producer soil samples in Montana found that Fe fertilization would be recommended on 6% of the soils, and Zn fertilization would be recommended on 18% of the soils based on current Montana fertilizer guidelines (Haby and Sims, 1979; Jacobsen et al., 2005). All of the tested soils had adequate levels of Cu and Mn. Soils with adequate Zn were relatively concentrated. For example, Blaine, Phillips, Roosevelt, and Valley Counties in Montana had no samples testing low for Zn. Counties with at least 25% of their samples deficient in Zn included Big Horn, Carbon, Fallon, Hill, Musselshell, Richland, and Stillwater (Montana). With the exception of Hill, these counties are largely located in the lower Yellowstone Valley, where Zn deficiencies and growth responses to Zn fertilization have been previously documented (Halvorson and Bergman, 1983). The study suggests that it may prove worthwhile to test for Zn on soils located in central and eastern Montana, but likely less worthwhile on soils located in northern and northeastern Montana. Keep in mind that testing only indicates a nutrient deficiency, and can only predict a probability of a fertilizer response. To make certain that no deficiencies are occurring on a field of interest, a small section of the field can be treated with a mixed micronutrient solution, and any differences in yield and plant health noted.
Tissue testing for Micronutrients
An alternative to soil testing is to sample plant tissue for micronutrients, and compare the tissue concentrations to a sufficiency range for a particular crop. For example, Havlin et al. (1999) report a sufficiency range for small grains of 15-70 ppm Zn contained in the four uppermost leaves from the top of the plant. In Montana, with the exception of Cl (Engel, 1993), there are no published fertilizer recommendations for a specific micronutrient tissue test. Due to the variability within a plant, and the variability within a growing season (Bell, 2000), tissue testing is less accepted than soil sampling for determining fertilizer requirements, yet can represent a reasonable tool to identify deficiencies.
Growth Responses to Micronutrient Fertilization
Micronutrient deficiencies are relatively uncommon in the Great Plains; however, there are areas within this region where micronutrient deficiencies have either been observed or have been suspected. A number of studies have assessed the effects of micronutrient fertilization in these areas, and growth responses were determined in some, but not all of these studies. Results of these studies follow.
Boron
Deficiencies of B in alfalfa have been identified in Western Montana (Graham, 1984). Conversely, studies conducted in the Western Triangle (Ledger, Montana) on alfalfa found no significant growth responses to B fertilization even on a soil with a soil test B of only 0.41 ppm (Jackson and Miller, 1998). A study of 33 sites in the three prairie provinces of Canada found no correlation between the relative yield of canola seed and hot water-extractable B (Goh and Karamonos, 2002). In addition, foliar, broadcast, and incorporation of B at four of these sites produced no significant yield increases, and a significant yield decrease at one of these sites that had only 0.5 ppm water-soluble B. The conclusion of the study was that responses to B fertilizer are likely rare on Canadian prairie soils.
Table 3. Effect of Cl fertilization on leaf spot severity, yield, and shoot Cl concentration in WB881 durum.
| Fertilizer Cl (lb/ac) |
Flag Leaf Spot Severity (%) |
Yield (lb/ac) |
Shoot Cl (ppm) |
| 0 | 87 | 2954 | 540 |
| 40 | 6 | 3615 | 5520 |
Chloride
A soil near Poplar, Montana that had an average of 0.64 ppm Cl in the upper 3 feet was fertilized with 0 and 40 lb/acre Cl (as KCl) and planted with durum wheat (WB881). The Cl fertilizer decreased spot severity from 87% to 6% in the flag leaf, and increased yield by 22% (Table 3). Previous work on winter wheat found that grain yield increased 16% when 20 lb Cl/acre was applied to a soil containing approximately 1.5 ppm Cl in the upper 2 feet (Engel et al., 1998). In both studies, K2SO4 was applied as the check treatment to make certain that K was not causing the yield increase. Results from studies on both winter and spring wheat suggest a critical plant tissue Cl concentration between 1,000 and 4,000 ppm (Engel et al., 1998). It was determined that soil Cl plus fertilizer Cl should be between 8.5 and 36 lb/ac to reach these minimum and maximum critical concentrations. Chloride has also been found to prevent plant diseases such as root rot and spot blotch in small grains in North Dakota (Havlin et al., 1999).
Copper
A study conducted at the Western Triangle Agricultural Research Center in Conrad, Montana, on a soil with 1.2 to 1.7 ppm extractable Cu, found no yield increases in 9 of 10 spring wheat and durum varieties (Jackson and Christiaens, 1995). Yield responses to copper are not expected in most Montana soils based on a study that found that 100% of 301 producer soils in Montana tested adequate (>0.2 ppm) in DTPA Cu (Haby and Sims, 1979). Conversely, studies in Alberta have found Cu fertilization has resulted in wheat yield increases of up to three-fold in soils having extractable Cu concentrations <0.4 ppm (Goh and Karamanos, 2001).
Iron
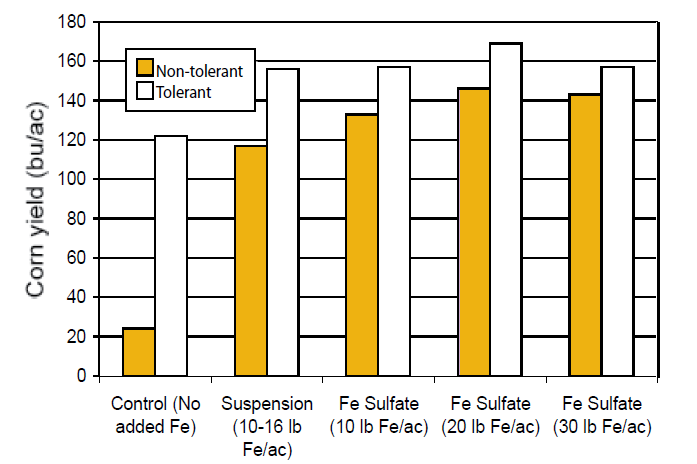
Iron deficiency is observed in the Great Plains, especially in corn and legumes grown on high pH, calcareous soils. Deficiencies are indicated by ‘interveinal chlorosis’, which means that the veins remain green, yet the leaves between the veins are yellow. Nutrient deficiency symptoms are described in more detail in Nutrient Management Module 9. A study on a pH 8.6 soil with 2.9 ppm DTPA Fe in Nebraska assessed the effect of Fe fertilizers on sweet corn yields for both chlorosis-tolerant and non-tolerant hybrids. The study found that the average yield of tolerant hybrids was approximately six-fold higher than the yield of non-tolerant hybrids from 1997-1999 (Figure 4). In addition, Fe fertilizer placed in seed rows (2 inches to the side and 2 inches below the seed) was able to overcome most of the difference between hybrids, although yield decreased at the highest Fe treatment (30 lb Fe/ac), likely due to a salt effect. Similar yields were obtained using either a liquid Fe suspension or dry granules.
Figure 4. The effect of Fe fertilization on corn yield in a high pH, low Fe soil for both chlorosis-tolerant and non-tolerant hybrids (modified from Stevens et al., 2001).
Zinc
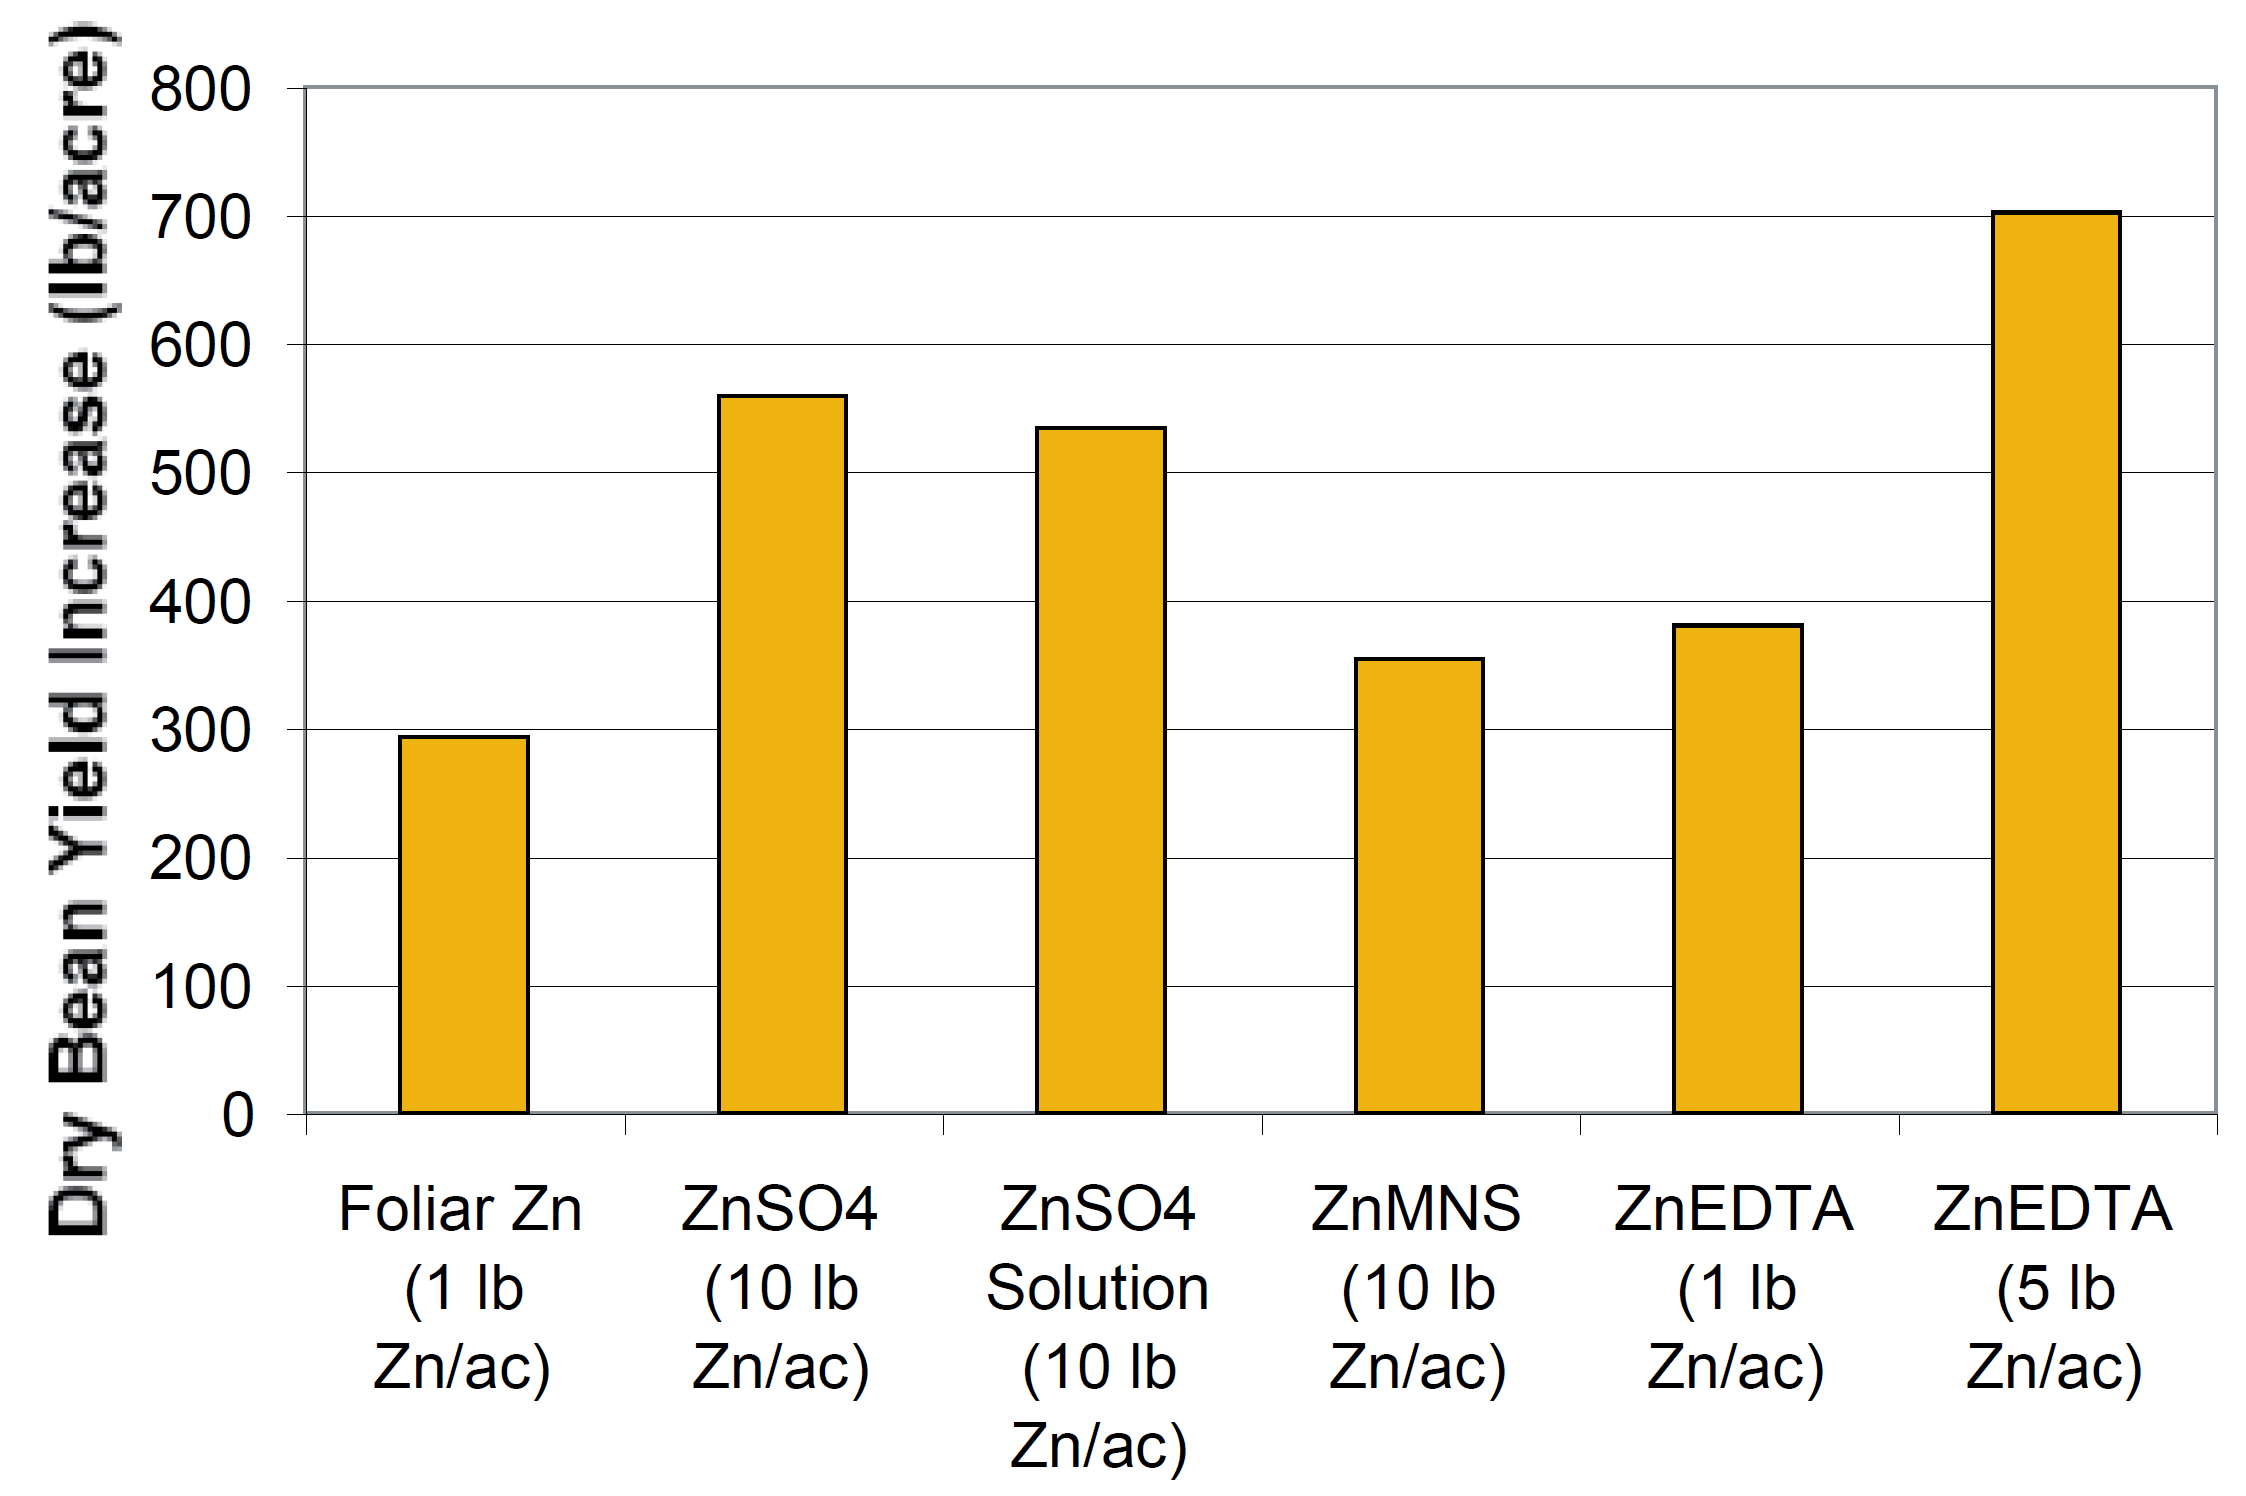
Dry beans grown in the Lower Yellowstone Valley of Montana have been noted to have Zn deficiencies, especially when grown in soil with high available P concentrations. Foliar and soil applications of Zn were applied to an irrigated silty clay located in the valley (near Sidney, Montana) that had greater than 60 ppm soil test P and less than 1.2 ppm DTPA Zn. Average grain yield over a three year period was increased by approximately 300 lb/ac with a foliar application of 1 lb Zn/ac as ZnSO4, and by up to 700 lb/ac when soil was fertilized with ZnEDTA (a chelated form of Zn) at 5 lb Zn/ac (Figure 5). The researchers concluded that a yield response was highly probable on soils with > 25 ppm soil test P and < 1.5 ppm DTPA Zn. To overcome Zn deficiencies, they recommended using ZnSO4 (due to cost) either as a 0.5% solution at 20 to 30 gal/ac for a foliar application or 10 lb Zn/ac broadcast or incorporated before seeding. Based on the low mobility of Zn, banding and direct seed applications should be effective application methods. A 5 lb Zn/ac starter fertilizer, placed 2 inches to the side and 2 inches below the seed, increased navy bean yield by approximately 12% near Powell, Wyoming (Blaylock, 1996). In addition, the damage percentages of harvested bean seed were 14.7% for the check treatment and 8.8% for the 5 lb Zn/ac treatment.
Figure 5. Increase in yield due to Zn fertilization on a low Zn (<1.2 ppm), high P (>60 ppm) soil in Montana (data from Halvorson and Bergman, 1983). ZnMNS is a zinc, manganese, nitrogen, and sulfur mix.
Fertilizing a loamy sand in Colorado that had low available Zn (0.48 ppm) with 3 ppm Zn increased corn yield by approximately 4 – 30% depending on the form of Zn fertilizer (Westfall et al., 2001). The fertilizers with higher concentrations of water-soluble Zn (ZnSO4, ZnEDTA, and a combined ZnSO4-paper waste) resulted in significantly higher yields than the lowest water-soluble Zn fertilizer (Zn sucrate). Therefore, if fertilizing with Zn, make certain to compare price per percent water- soluble Zn.
Micronutrient Fertilizers
Micronutrient fertilizers are generally supplied as either liquid foliar applications or dry product for application to the soil. Foliar applications are often more effective per pound of micronutrient because a higher percentage of the applied nutrient is generally absorbed by the plant. Due to the cost of mixing and transporting liquids, however, foliar applications are more expensive per pound of micronutrient. Therefore, the decision regarding whether to purchase foliar or dry product fields using re-used return flows. Second,formulations will generally be driven by choose a fertilizer based on availability and ease of application and economics.
Table 4. Some common micronutrient fertilizer sources
Micronutrient |
Fertilizer name |
Fertilizer Formula |
Solubility * |
Micronutrient content (%) ** |
| Boron |
Borax
Boric acid
|
Na2B4O7·10H2O
H3BO3
|
Low
Medium
|
11
10
|
| Chloride | Potassium Chloride |
KCl |
High | 47 |
| Copper | Copper sulfate | CuSO4·5H2O | Medium | 25 |
| Iron | Ferroussulfate Iron oxalate Iron EDTA |
FeSO4·7H2O Fe2(C2O4)3 Varies |
Medium High Varies |
20 30 5-14 |
| Manganese | Manganous sulfate | MnSO4·4H2O | High | 25 |
| Zinc | Zinc Sulfate Zinc EDTA |
ZnSO4·H2O Varies |
Medium Varies |
36 6-14 |
* Low: < 5 lb product/100 lb water, Medium: 5-50 lb/100 lb water, High: > 50 lb/100 lb water (CPHA,
2002).
** The range of micronutrient content for EDTA forms are based on common liquid forms for the low
number up to common dry forms for the high number (CPHA, 2002).
Available Micronutrient Fertilizers
Table 4 lists common micronutrient fertilizers and the percentage of micronutrient in each fertilizer. Chelated
forms of metal micronutrients, such as ZnEDTA, are generally much more expensive than non-chelated forms, but are also much more effective per lb of Zn as shown in Figure 5. In choosing a fertilizer, target those with medium-high solubilities, and compare cost per percentage of micronutrient.
Micronutrient Fertilizer Calculations
Determining the amount of micronutrient fertilizer to apply is very similar to determining the amount of N
fertilizer to apply. First, use historical data, your experience, or soil test data combined with research-based fertilizer guidelines to determine the pounds of micronutrient to add per acre. In irrigated areas of Montana and Wyoming, irrigation water should be tested and the results considered before micronutrient fertilizers are prescribed. This is particularly important for irrigated fields using re-used return flows. Second, choose a fertilizer based on availability and the criteria outlined above. Third, calculate the fertilizer requirement based on the percentage of micronutrient from Table 4. See Calculation Box for an example.
Summary
Micronutrients are no less essential to plant growth than the macronutrients; they are simply needed in smaller amounts. The metal micronutrients are held strongly by the soil, especially at pH levels above 7. The anion micronutrients are held less strongly; with the exception of Mo. Deficiencies of micronutrients exist in Montana and Wyoming, although their occurrence is relatively rare. However, in areas where micronutrient deficiencies occur, the ability to identify these deficiencies either visually, with soil testing, or with plant tissue testing is necessary to determine if micronutrient fertilizers are needed. The most common micronutrient deficiencies in Montana and Wyoming are believed to be boron, chloride, iron and zinc. Micronutrient deficiencies can usually be overcome with fertilizers, although additions of organic matter, such as manure, will often increase micronutrient availability. Due to the poor mobility of most micronutrients, placement near the seed, foliar applications, and using ‘chelated’ micronutrients have proven most successful at producing growth responses.
Calculation Box
Calculation: Zn fertilizer to apply = Zn recommendation/Zn fraction in fertilizer
Example: The Zn soil test is 0.4 ppm. From Table 2 or EB 161, the Zn fertilizer recommendation is 5 lb Zn /ac. How much Zn sulfate (ZnSO4·H2O) is needed to meet this recommendation?From Table 4, the percentage of Zn in Zn sulfate is 36%. Expressed as a fraction, 36% =
0.36.
Amount of Zn sulfate needed = (5 lb Zn /ac)/0.36 = 14 lb/ac Zn sulfate. For comparison,
how much liquid ZnEDTA with 6% Zn would be needed? Answer: 84 lb/ac
References
Bell, R.W. 2000. Temporary nutrient deficiency – a difficult case of diagnosis and prognosis by plant analysis. Commun. Soil Sci. Plant Anal. 31:1847-1861.
Blaylock, A. 1996. Improving dry bean production with starter fertilizers. In Great Plains Soil Fertility Conference, Mar. 4-6, 1996. Denver, CO. p. 301-311.
Cakmak, I., B. Torun, B. Erenoglu, L. Ozturk, H. Marschner, M. Kalayci, H. Ekiz, and A. Yilmaz. 1998. Morphological and physiological differences in the response of cereals to zinc deficiency. Euphytica. 100: 349-357.
CPHA. 2002. Western Fertilizer Handbook. 9th Edition. Interstate Publisher, Inc. Danville, Illinois. 356 p.
Engel, R.E. 1993. Winter wheat response to chloride fertilizers. Fertilizer Fact #3. Montana State University Extension.
Engel, R.E., P.L. Bruckner, and J. Eckhoff. 1998. Critical tissue concentration and chloride requirements for wheat. Soil Sci. Soc. Am. J. 62:401-405.
Engel, R, L.J. Bruebaker, and T.J. Ornberg. 2001. A chloride deficient leaf spot of WB881 Durum. Soil Sci. Soc. Am. J. 65: 1448-1454.
Fageria, N.K., V.C. Baligar, and R.B. Clark. 2002. Micronutrients in crop production. Adv. in Agron. 77:185-268.
Goh, T.B. and R.E. Karamanos. 2002. Response of wheat and canola to copper and boron in the Canadian prairie regions. Great Plains Soil Fertility Conference Proceedings. March 5-6, 2002, Denver, CO. p. 281-287.
Graham, D.R. 1984. Alfalfa fertilizer recommendations by plant analysis. In Montana AgResearch. Vol. 1. Spring 1984. p. 22-26.
Grewal, H.S. and R. Williams. 1999. Alfalfa genotypes differ in their ability to tolerate zinc deficiency. Plant Soil. 214:39-48.
Haby, V.A. and J.R. Sims. 1979. Availability of micronutrient cations in Montana soils. Montana Agricultural Experiment Station. Bulletin 706.
Halvorson, A.D. and J.W. Bergman. 1983. Zinc fertilization of dry beans on soils high in available phosphorus. Montana Agricultural Experiment Station, Bozeman, Montana, and Northern Plains Soil and Water Research Center. USDA-ARS, Sidney, Montana. Bulletin 751.
Havlin, J.L., J.D. Beaton, S.L. Tisdale, and W.L. Nelson. 1999. Soil Fertility and Fertilizers. 6th Edition. Prentice Hall. Upper Saddle River, NJ. 499 p.
Jackson, G. and L. Christiaens. 1995. Fertilizer response of selected spring wheat and durum varieties. Western Triangle Research Center 1995 Annual Report. Conrad, Montana.
Jackson, G. and J. Miller. 1998. Effect of Boron Fertilization on Alfalfa Production (MT-13F). In Western Triangle Ag Research Center Annual Report. 1998. Conrad, Montana.
Jacobsen, J., G. Jackson, and C. Jones. 2005. Fertilizer Guidelines for Montana Crops. Montana Agricultural Experiment Station, Bozeman, Montana. EB 161.
Lindsay, W.L. 1979. Chemical Equilibria in Soils. Wiley-Interscience. John Wiley & Sons, New York. 449 p.
Stevens, B., G. Hergert, and J. Petersen. 2001. Strategies for improving maize yields on high pH soils. Western Nutrient Management Conference Proceedings-Vol. 4. March 8-9, 2001. Salt Lake City, Utah. p. 107-115.
Westfall, D.G., W.J. Gangloff, G.A. Peterson, and J.J. Mortvedt. 2001. Organic and inorganic Zn fertilizers: Relative availability. Western Nutrient Management Conference Proceedings-Vol. 4. March 8-9, 2001. Salt Lake City, Utah. p. 123-129.
Resources
Books
Western Fertilizer Handbook. 9th Edition. 2002. California Plant Health Association. Interstate Publisher, Inc. Danville, Illinois. 356 p. (http://www.amazon.com) $50.
Plant Nutrition Manual. J. Benton Jones, Jr. 1998. CRC Press, Boca Raton, Florida. 149 p. Approximately $50.
Soil Fertility and Fertilizers, 6th Edition. J.L. Havlin et al. 1999. Upper Saddle River, N.J.: Prentice Hall. 499 p. Approximately $100.
Extension Materials
Availability of Micronutrient Cations in Montana Soils. Bulletin 706. Free.
Fertilizer Guidelines for Montana Crops, EB 161. Free.
Nutrient Management Modules (1-15) All are online in PDF format in the category of ag and natural resources, at http://www. msuextension.org/publications.asp
Obtain the above Extension materials (add $1 for shipping) from:
See We