

Potassium Cycling, Testing, and Fertilizer Recommendations
This module is the fifth in a series of Extension materials designed to provide Extension agents, Certified Crop Advisers (CCAs), consultants, and producers with pertinent information on nutrient management issues. To make the learning ‘active,’ and to possibly provide credits to Certified Crop Advisers, a quiz accompanies this module. In addition, realizing that there are many other good information sources including previously developed Extension materials, books, web sites, and professionals in the field, we have provided a list of additional resources and contacts for those seeking more in-depth information about potassium.
Last Updated: 06/05by Nathan Korb, Clain Jones, and Jeff Jacobsen
Objectives
- Learn the various soil forms of potassium
- Understand the soil processes that affect the availability of potassium to plants
- Understand how soil and climate properties affect potassium cycling
- Be able to make potassium fertilizer recommendations based on soil analysis and site characteristics
Background
Potassium (K) is abundant in most Montana and Wyoming soils, but the vast majority of soil K is unavailable to plants. Plants require K for photosynthesis, ATP production, translocation of sugars, starch production in grains, nitrogen fixation in legumes, and protein synthesis. In corn and other crops, K strengthens stalks and stems, thus helping with disease and lodging. Plants take up potassium as K+ ions. The concentration and availability of K in the soil is primarily controlled by inorganic processes. Although K does not pose the potential environmental concerns that nitrogen (N) and phosphorous (P) do, an understanding of K cycling and availability is important for the management of profitable, long-term cropping systems because K exists in finite amounts in the soil and can limit plant use of other nutrients. The purpose of this module is to explain the factors that govern the ability of a soil to meet crop K needs in order to help with K management decisions.
Potassium Cycling
Forms of K
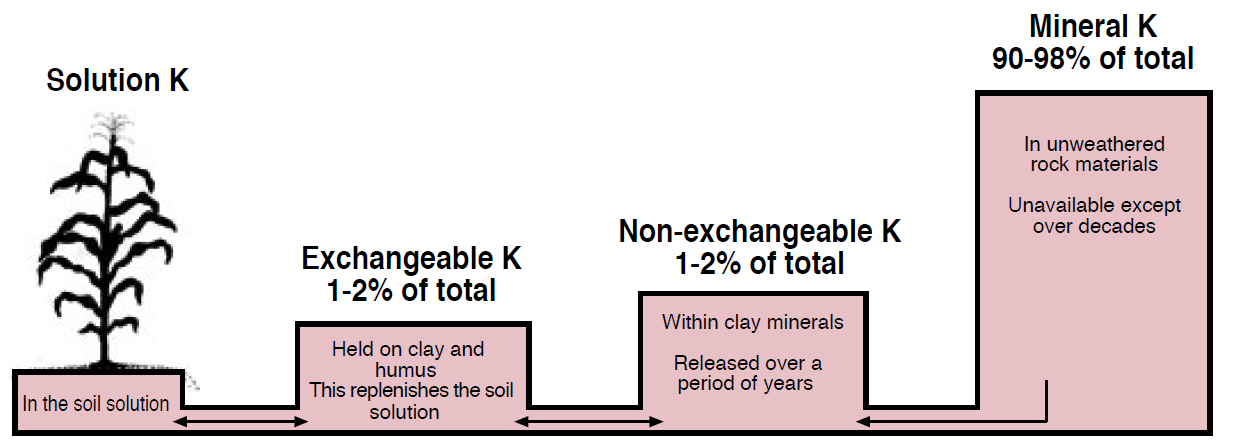
Potassium exists in the soil as dissolved K+ ions (solution K), exchangeable K, nonexchangable K, and mineral K (Figure 1). Plants can only directly absorb solution K, yet solution K concentrations range from only 1 to 10 mg/L (ppm). Plant available K includes solution K and exchangeable K. Solution K+ exists in equilibrium with the exchangeable, nonexchangeable, and mineral phases of potassium (Figure 2). Unlike N and P, K is not incorporated into the plant structure; therefore, K is not bound in organic forms, but is quickly released back into the soil from crop residues and roots.
Exchangeable K is weakly sorbed to the surfaces of soil particles and can rapidly replenish solution K. Nonexchangeable or “fixed” K is held within clay layers by strong bonds that make the nutrient inaccessible to plants. Mineral K is contained largely in unweathered primary minerals such as feldspars and micas. The processes governing the availability of K are mineral weathering, clay fixation and release, sorption and desorption, leaching, erosion, and plant uptake. K has been traditionally expressed as potash, or K2O. Although K does not actually exist in this form in the soil, K2O provides an accepted unit for discussion and reporting purposes and will be used throughout this module.
Figure 1. Forms of K found in the soil (Hoeft et al., 2000).
Weathering of Primary Minerals
Feldspar and mica minerals are common parent materials for most soils (Foth and Ellis, 1997). Feldspars (KAlSi3O8) are very resistant to weathering and are often found in sands, while the less resistant micas are a constituent of almost all clays. The K contained in the crystal structure of feldspars is released so slowly that there is little correlation between the amount of feldspars in the soil and the amount of plant available K. Feldspar weathering will replenish a K-depleted soil, but the time frame can be on the order of decades or even centuries.
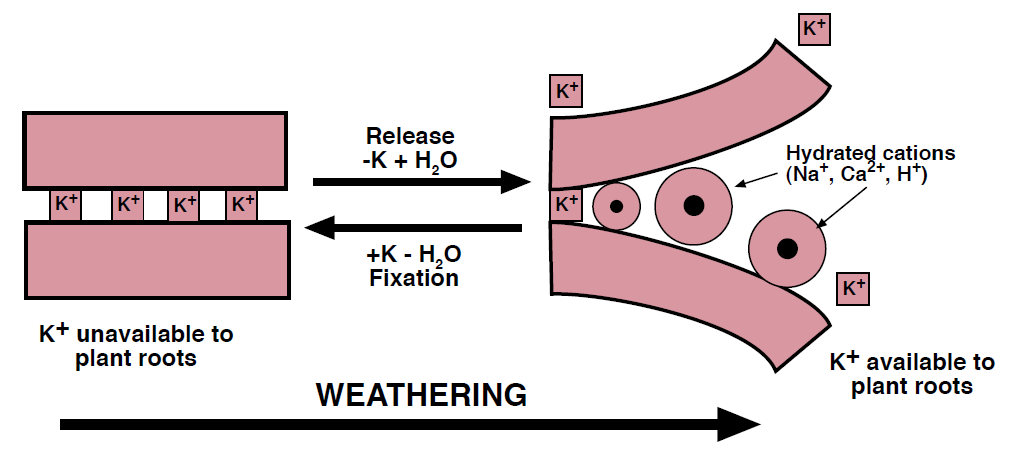
Micas come in diverse forms, ranging from relatively resistant muscovite to more easily weathered biotite. Potassium exists in the interlayer spaces of these silicate minerals and is released as the sheet-like crystal structures slowly peel apart (Figure 3). As the layers separate, the structure swells with water and K diffuses into solution. Depletion of solution K by plants or leaching can induce further mica weathering to maintain an equilibrium with the soil solution.
The release of mineral K is limited by the rates of weathering, which in cool, dry climates can be very slow. Mineral K is abundant in most soils in Montana and Wyoming due to the dry climate and the abundance of shallow, unweathered parent material.
Sorption and Desorption
Clay Fixation and Release
In minimally to moderately weathered soils that are typical in Montana and Wyoming, the high CEC clays cause fixation and release to be significant processes in K cycling. Some clays bind K in much the same way as micas and are capable of ‘fixing’ the nutrient within their layered structures (Figure 3). Clay fixation immobilizes K in a nonexchangeable form making it temporarily unavailable for crop uptake. With high K concentrations and dry conditions, the clay layers shrink together and make K unavailable to plant roots. The nonexchangeable K bound in layered clays is slowly released with the addition of water and the removal of K from the soil solution, but this process requires years or even decades to replenish a K depleted soil.
Figure 2. The potassium cycle.
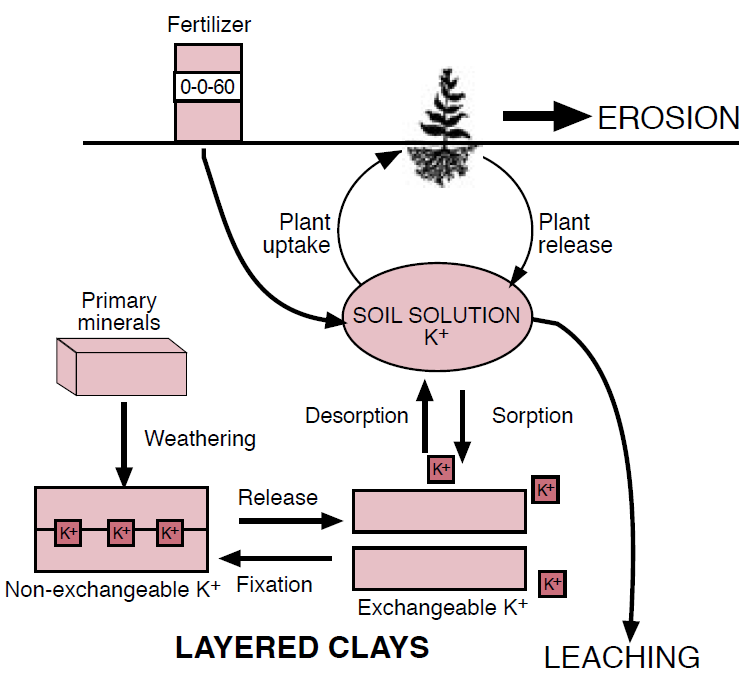
Figure 3. The weathering and “unzipping” of mica and layered clay minerals release K into soil solution. Fixation immobilizes K in a form unavailable to plants (Modified from McLean, 1978).
Potassium fixation and release by clay is closely related to soil pH and CEC (see NM Module 2, Plant Nutrition and Soil Fertility). As the pH increases (i.e., with increased lime), H+ ions are removed from cation exchange sites between clay particles. These negatively charged sites are more available for binding K+ (Figure 4), so the soil solution K decreases and the amount of nonexchangeable K stored in the soil increases. Following the same reasoning, soils with more cation exchange sites (i.e., higher CEC) will attract more K+ than a soil with fewer cation exchange sites, such as sandy soils. Soils with high CEC generally have large reserves of fixed K that can be slowly released for plant uptake.
Figure 4. Relationship between pH-dependent cation exchange capacity and K concentration in soil solution (Modified from Brady and Weil, 1999).
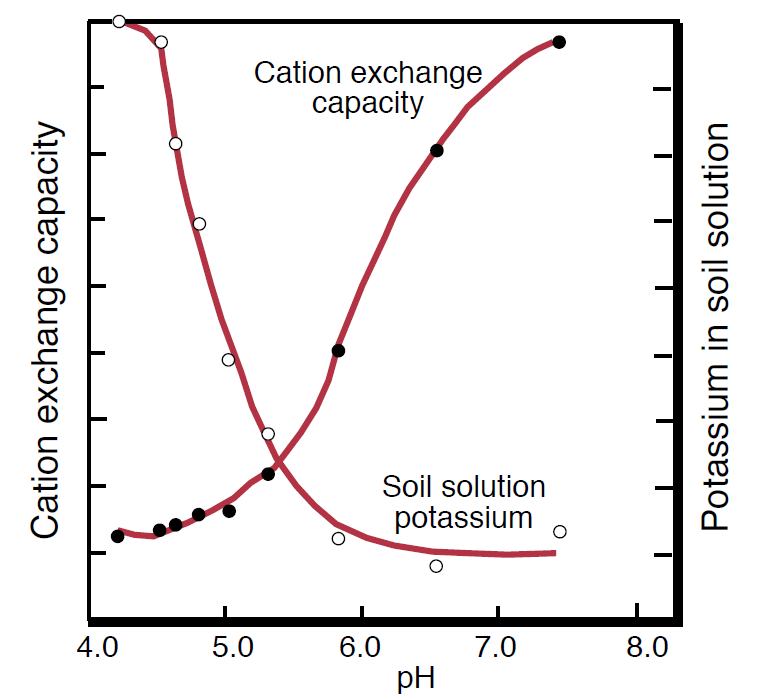
Figure 5. Soils with the same initial K levels may have very different abilities to supply K to crops over time (Hoeft et al., 2000).
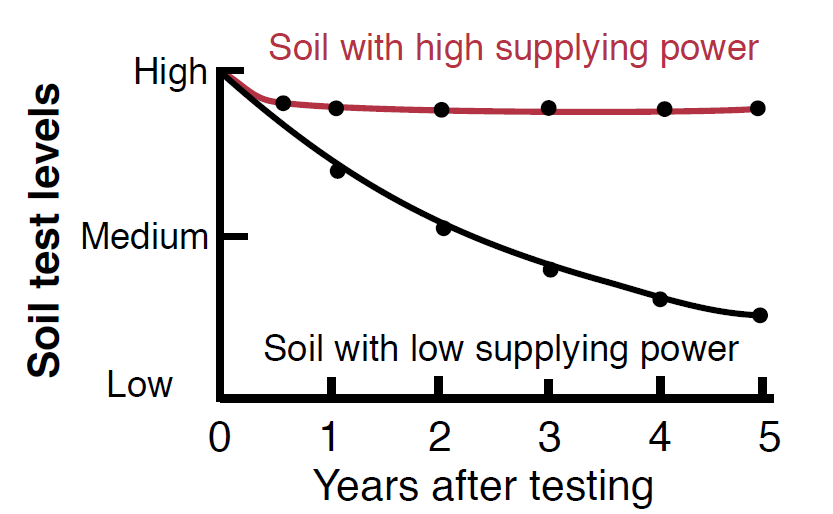
Soils with high K-fixing capacities have been found to show little response to large amounts of K fertilizer because the surplus of available potassium quickly binds to clays (Foth and Ellis, 1997). K fixation can be beneficial by reducing leaching losses of K and storing a reservoir of K for future crops. A soil with high K-fixing capacity will generally be capable of sustaining available K levels to a crop over many years of production, thereby buffering crop removal of K. This property has been called the ‘K supplying power’ of a soil. A sandy soil and a clay loam soil may have the same initial K test levels, but their response to crop uptake of K will probably be very different because sands have low CEC’s and therefore a lower K supplying power than clay loams (Figure 5).
K Exchange
Exchange refers to the equilibrium maintained between solution and exchangeable K through the processes of sorption and desorption. The potassium cation, K+, sorbs, or ‘sticks’, to the negative surfaces of soil colloids due to weak electrostatic attraction. When solution K is depleted, K desorbs, or frees itself, from soil particles and enters solution. The amount of K in solution at any given time is equal to 1 to 3% of exchangeable K for most soils. When the amount of exchangeable K is low relative to solution K, such as after recent fertilization, some K will leave solution and sorb onto soil colloid surfaces. Similarly, as plants absorb K from soil solution, some K will immediately desorb and replenish the solution, thus maintaining the balance between these two phases.
Potassium competes with other cations for exchange sites on clays; therefore, high concentrations of Ca+2, Mg+2, Na+, NH4+, and/or Al+3 can affect the amount of K sorbed. In calcareous soils, high concentrations of Ca+2 dominate clay surfaces, limit K sorption, and increase the dissolved fraction of K. The similarity in size and charge of ammonium (NH4+) and K ions allows NH4+ to replace K between clay layers. High concentrations of NH4+ can also increase solution K+ concentrations. The presence of these competing cations increases the mobility and availability of K by occupying sites where K would otherwise be sorbed.
Desorption is the most important process in replenishing solution K during a growing season and responds rapidly to the changes associated with plant uptake of K from soil solution. The supplying power of a soil over a growing season is dependent on the amount of K held on exchange sites (Figure 6). Soils with high CEC values generally have the ability to maintain a sufficient supply of K to the plants throughout the growing season without depleting the exchangeable soil K pool. Low CEC soils often lack the capacity to sorb sufficient K reserves to satisfy crop requirements over a growing season. Although soil organic matter often accounts for a significant portion of total CEC, its affinity for K is very low relative to Ca and Mg (Skogley, 1975). The mineral CEC is therefore more important in K cycling than total CEC (mineral CEC + organic CEC).
Leaching and Erosion
Leaching depends on the concentration of K in the soil solution, the amount of water moving through the soil, and the ability of the soil to bind K. Because only a small percentage of K is in solution at any given time, leaching requires consistently high precipitation or intensive irrigation conditions to severely deplete soil K. The ability of soil to sorb and hold K in place is dependent upon mineral CEC, so K movement in the soil is more common in coarse, sandy soils with low CEC’s. Considering the low annual precipitation and the generally high CEC soils of Montana and Wyoming, leaching is probably not a great concern when compared to the amount of K removed by crop uptake and removal.
Erosion by wind and water removes soil from the top of the profile where plant available K is usually highest, due to plant recycling of the nutrient. Therefore, minimizing erosion losses will help maximize the amount of K available for crops.
Q&A #1
What is the difference between ‘fixed’ and ‘exchangeable’ sorbed K?
These two sorbed phases of K exist in a dynamic equilibrium with soil solution but are very different in how readily they respond to changes in solution K+. Fixed K is bound deep within the soil particles and requires long periods of time, on the order of months to years, to equilibrate with the soil solution. Exchangeable K can be released quickly because it is only weakly held to the surfaces of soil particles, where it is in close contact with the soil solution.
Figure 6. Soils with the same initial K levels may have very different abilities to supply K to crops during a growing season (Hoeft et al., 2000).
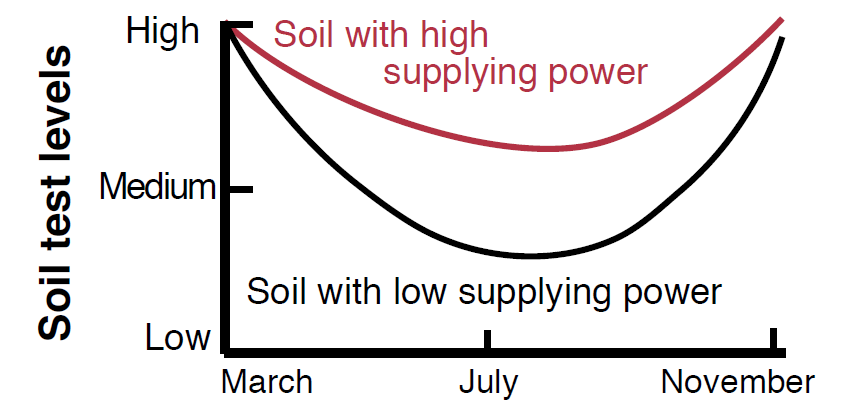
Table 1. K removal amounts in harvested portions of selected agricultural crops.
| Crop | Assumed Yield Per Acre | K2O REMOVAL (LB/AC) |
| Alfalfa | 2.5 t | 150 |
| Barley | 50 bu | 80 |
| Brome | 1.5 t | 95 |
| Corn silage | 20 t | 167 |
| Orchard grass | 1.5 t | 75 |
| Potatoes | 300 cwt | 330 |
| Sugar beets | 25 t | 460 |
| Timothy | 1.5 t | 94 |
| Wheat | 40 bu | 80 |
From CFA (1995). Wheat and barley removal include head and straw.
Plant Uptake
Plant uptake is the most significant removal process in K cycling. When compared with other nutrients, K uptake is generally second only to nitrogen uptake, and in some plants such as sugar beets and potatoes, K greatly exceeds N in plant uptake (CFA, 1985). The K held in the harvested portions of the crop represents the actual removal of K from the system. Annual K removal can range from 50 to 500 lbs K2O/ac for selected agricultural crops, depending on crop yield (Table 1). To estimate K2O uptake for a specific field, divide actual yield by the yield in the table and multiply this result by the K2O uptake given. K removal for small grains will be approximately 75% less than shown in the table if the straw and chaff is left on the field. Because K is not incorporated into plant tissue, leakage of K from the roots and leaching of K from the leaves return K to the soil late in the growing season when K is no longer needed by the crop. If most of the plant matter is removed at harvest, plant uptake can represent a severe depletion of available K. For example, a high-yielding legume hay crop may remove 250 lb K2O/ac each year (Brady and Weil, 1999).
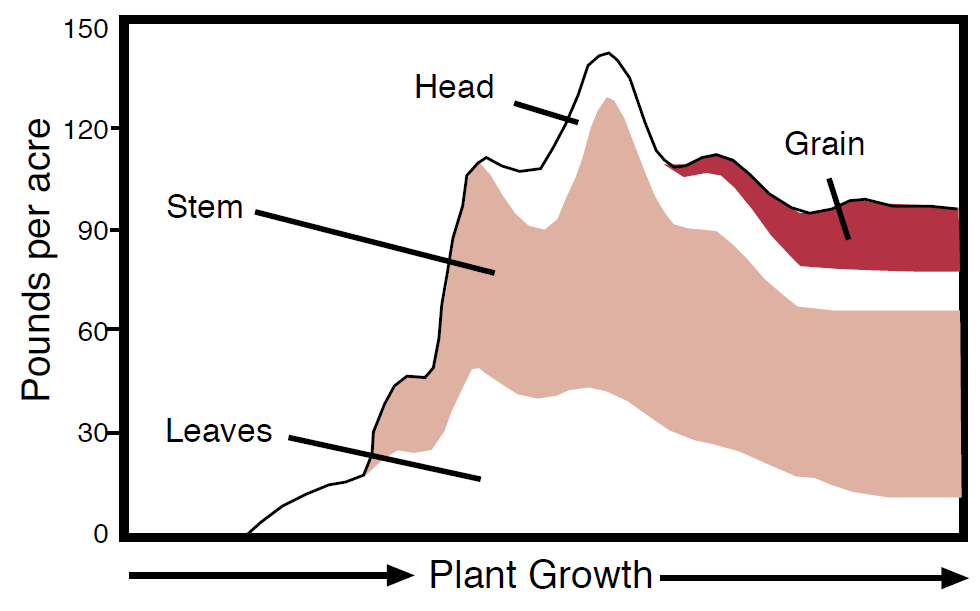
Figure 7. Potassium accumulation of K during growing season for hard red spring wheat (Jacobsen et al., 1992).
Plant uptake can also influence the turnover of available K in the soil. Deep-rooted plants, when left on site, can act as nutrient pumps by removing K from the subsoil and depositing it at the surface at the end of the season. This process makes previously inaccessible K available for shallow rooting crops.
Soil water containing dissolved K moves toward the plant roots due to plant uptake of water. This process of mass flow contributes to only a small fraction of total plant K uptake. Diffusion of K to plant roots accounts for the majority (>75%) of plant uptake, and usually occurs within about 1/6 of an inch of the plant roots (see NM Module 2 for more about diffusion and mass flow). Both diffusion and mass flow require sufficient water in the soil to transport K to the roots and for plants to absorb the nutrient. Increasing soil moisture from 10 to 28% has been shown to increase total K transport by 175% under certain conditions (Skogley and Haby, 1981). Dry conditions can limit nutrient transport to and into the plant and thus cause K deficiency.
Soil temperature and aeration influence plant uptake of K by affecting both root activity and diffusion. Montana and Wyoming’s northern latitudes and higher elevations make temperature especially important to K availability. Reduced temperatures inhibit diffusion and slow plant processes, root growth, and the rate of K uptake. In studies with corn, the root length increase over a 6 day period was eight times greater at soil temperatures of 84º F than at 59º F (Ching and Barber, 1979). The K concentration in the shoot was 8.1% at 84 ºF and 3.7% at 59 ºF indicating that K uptake increased with warmer temperatures. Most crops absorb K early in the season and reach their maximum K concentration while N and P concentrations are still increasing (see NM Module #2, Figure 3). Because K is mobile in plants, the nutrient moves from the stem and leaves of wheat to the grain without increasing total K content (Figure 7). In fact, the total K content of wheat actually decreases during grain production.
Aerated soils supply roots with the oxygen necessary for normal functioning. Plants absorb oxygen through their roots during the night when they are respiring. Of all macronutrients, K absorption is most limited by saturated soil conditions. In a study of corn grown in silt loam soils, K uptake in aerated soil was four times greater than in non-aerated soil. Uptakes for nitrogen and phosphorus were only 1.5 and 1.3 times greater under the same conditions (Lawton, 1946). The reduction of soil pore space by compaction impedes diffusion by making the path for the K ions more tortuous because of smaller pores.
Plants draw nutrients into their roots by tapping the soil solution and creating a concentration gradient across their root membranes. Cationic nutrients then compete for absorption into the plant via osmosis. In soils with high amounts of Ca+2 and Mg+2, competition can limit K uptake. Crops grown on highly calcareous soils frequently have K-deficiency symptoms even though the soil test may report sufficient K. The availability of K can be more dependent on its concentration relative to that of Ca+2 and Mg+2 than total available K in such soils (Havlin et. al., 1999).
A unique property of K plant uptake is luxury consumption. When available K exceeds plant needs, plants continue to absorb K without any increase in crop yield. Because K fertilization in Montana is minimal, luxury consumption is probably uncommon, but it certainly can be a negative consequence of over-fertilization. Although there are no environmental threats associated with luxury consumption, the added resources are lost with no additional profit.
Q&A #2
How do temperature and water content affect diffusion in soil?
Diffusion is the random movement of K ions in water that cause K to move from areas of high K concentrations to areas of low K concentrations. At cool water temperatures, the random motion of the water is slow, thus the rate of diffusion is slow. Such conditions are common in Montana and Wyoming in the spring when most crops are planted in cool, moist soil. The water in soil pores serves as the path along which diffusion occurs. When the soil becomes drier, this conduit of water becomes smaller as it winds more closely around charged soil particles. This smaller, more tortuous path limits the random motion of the water and thus the diffusion of K.
Soil Testing for K
The primary goal of soil testing for K is to determine the amount of K available to crop or range plants at a given site. Soil sampling methods and laboratory selection were described in detail in Nutrient Management Module 1, Soil Testing and Laboratory Selection. Solution and exchangeable K are the important forms for plant growth and they are extracted from a soil sample by 1 M ammonium acetate (NH4OAc). The extraction is then measured for K content.
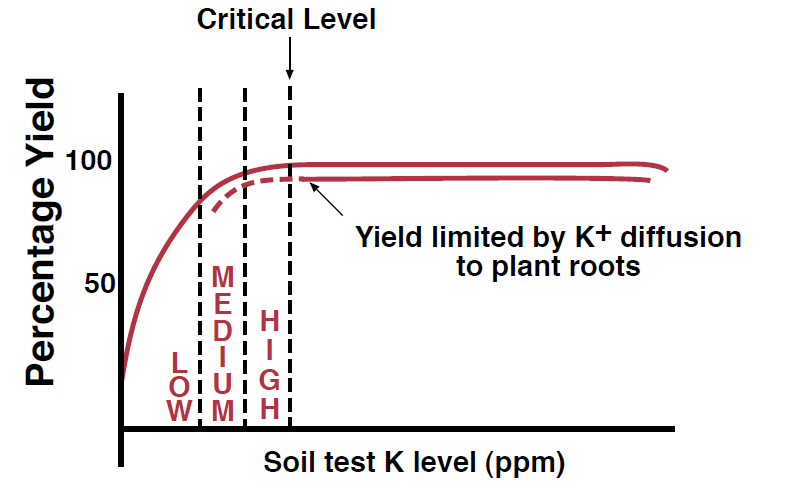
Figure 8. Relationship between soil test K level and crop yield.
Another promising soil testing technique is using anion exchange resins, either encapsulated in a synthetic mesh or in a probe. The advantage of a resin over an extractant is that the resin better imitates a plant root by decreasing solution K and promoting K desorption, dissolution, and diffusion. Because diffusion is an especially important factor in the cool, dry regions of Montana and Wyoming, ion-exchange resin tests may be more reliable indicators of plant available K than conventional NH4OAc extraction tests (Yang and Skogley, 1992).
Q&A #3
How are the results from ammonium acetate extraction and resin capsule tests different?
Ammonium acetate extractions estimate the total amount of exchangeable and solution K in a soil by mixing and flushing a soil sample with extractant in the laboratory. Resin capsules can be used in the field with minimal soil disturbance to mimic the nutrient uptake of a plant root. Resins effectively estimate the amount of K a root can absorb under actual soil conditions. Extraction methods are more widely used than resin capsules because exchangeable K results have been useful in predicting yield response for most agricultural soils where diffusion is not limiting (i.e., warmer, wetter soil conditions). Over the decades that extraction tests have been used, there has been extensive soil test calibration research correlating the results to fertilizer recommendations. Resin capsules are a relatively new method, so the applied calibration research to interpret the results is limited.
Available K is measured in parts per million (ppm). Only the top six inches of soil is generally tested for K because the surface soil is the most significant source of K for most plants and because it can be managed directly with fertilizers, tillage, and cropping systems. The relationship between soil test K and relative yield response in Montana and Wyoming has been a subject of significant research (Figure 8, previous page). Soil test levels are categorized into low, medium, or high, and sometimes also into ‘very high’ and ‘very low.’ At soil test K levels below the ‘critical level’ the probability that a yield increase will result from fertilizer addition is high. Above the critical level, insignificant yield responses to K fertilization would generally be expected. In Montana, despite the fact that nearly all major agricultural soils are in the ‘high’ to ‘very high’ category, K applications can still result in significant yield responses, particularly with malt barley yield and quality (Skogley, 1975). Additionally, a study using 13 years of research at locations throughout Montana found little correlation between NH4OAc-extracted K test values and crop response to K fertilization (Skogley and Haby, 1981). Although several alternative soil K tests were tried in this study, none were found that consistently predicted crop responses to fertilization in cool, semi-arid climates. Therefore, monitoring yield responses to K fertilization on specific fields is recommended to supplement and validate soil test results.
Calculation Box 1
Based on a soil test level of 300 ppm K in the top 6" of soil, how long will the present ‘pool’ of exchangeable and solution K support an alfalfa crop which removes 150 lb K2O/ac per year?
Calculation of plant available ‘pool’ of K in this soil:K (lb/acre) = K concentration(ppm) x 2 x sample thickness/6"300ppm x 2 x (6"/6") = 600 lbs K/acConversion of alfalfa uptake: lb K2O/ac x (.83 lb K / lb K2O) = lb K/ac150 lb K2O/ac x .83 = 125 lb K/acCalculation of how long present K ‘pool’ will sustain crop:Total plant available K ÷ Crop removal per year = Years of sufficient K supply600 lbs K/ac ÷ 125 lb K/ac = 4.8 years
If the mineral and nonexchangeable K ‘pools’ did not replenish crop removal of K, the exchangeable K of this soil would support the alfalfa crop for only 4-5 years.
In areas of the northern Great Plains-Intermountain region where soils test high or very high for K, crop responses tend to be highly dependent on soil and site characteristics, such as temperature, elevation, water content, and consistence (Veeh and Skogley, 1986). These properties can negatively affect the diffusion of K to the plant roots and limit crop yield even on a ‘very high’ testing soil. For this reason, it is important to understand how soil properties affect K cycling.
Because K availability changes so dramatically over the growing season, the time of year that soils are sampled is critical to effective management and must be consistent in order to monitor the K fertility of a site over time. Potassium levels are usually highest after the soils thaw in the spring and before plant uptake becomes substantial. Over the growing season, K is removed from solution and exchange sites by plants, so available K tests will be lowest in late summer. Testing the soil after the spring thaw will provide the most useful estimate for how much K is available for the crop in that season.
K Fertilizer Recommendations
According to traditional nutrient management strategies, fertilizer is not recommended for a nutrient that tests high in the soil because it will likely not result in a yield response. In our region, where nearly all agricultural soils test high for K, substantial research has shown that potash can increase yield significantly because diffusion of K is inhibited by cool soil temperatures, low water contents, and the presence of highly charged clays. These soil conditions are common throughout the northern Great Plains-Intermountain region.
Table 2. Responses to K fertilizer when included in fertilizer program (Skogley and Haby, 1981).
|
Crop
|
Response
Frequency (%)
|
Average Yield
Increase*
|
Average Application Rate*
(LB K2O/ac)
|
| Winter wheat | 47 | 5.5 bu/ac | 20 |
| Spring wheat | 30 | 4.8 bu/ac | 20 |
| Barley | 44 | 3.9 bu/ac | 32 |
| Barley (irrig.) | 70 | 9.2 bu/ac | 43 |
| Alfalfa hay | 50 | 694 lb/ac | 75-200 |
| Sugar beets (irrig.) | 30 | 220 lb/ac | 86-107 |
| Native range | 17 | 315 lb/ac | 70 |
*For sites that showed positive response to K fertilizer
In Montana, the critical level for small grains is generally considered to be 250 ppm K. In one study in Montana, soil extractable K values ranged from 174 ppm K to 856 ppm K with a mean of 376 ppm K (Jackson, 1998). All these values can be considered in the ‘high’ range for most crops. Research in Montana demonstrated that significant yield responses to K fertilization can still be expected from soils testing ‘high’ for K, when used with an optimum N and P program (Skogley and Haby, 1981). The study found that winter wheat yield increased in 47% of the experiments, from additions of approximately 20 lbs K2O /ac (Table 2). In no-till small grain production, where soils tend to be cooler and wetter than conventionally tilled soils early in the growing season, K additions of 17 to 33 lbs K2O /ac resulted in yield increases 26%, 43%, and 50% of the time for spring wheat, barley, and winter wheat respectively. The average response was 4 to 5 bu/ac (Jackson et al., 1991).
Table 3. Potassium Fertilizer Guidelines for five Montana crops (EB 161).
| Potassium Fertilizer Rates (lb K2O/ac) | |||||
| K Soil Test Level (PPM) | Wheat |
Malt Barley |
Sugarbeet |
Alfalfa |
Grass |
| 50 | 115 | 80 | 100 | 205 | 70 |
| 100 | 90 | 65 | 80 | 170 | 60 |
| 150 | 70 | 50 | 60 | 140 | 45 |
| 200 | 40 | 35 | 40 | 95 | 30 |
| 250 | 10 | 25 | 20 | 30 | 15 |
Placement of K fertilizer close to the seed is important in mitigating slow K diffusion in spring. When soil temperatures are cool, starter fertilizer ensures that sufficient K is readily available to the plant. As temperature increases, plant root growth and diffusion rates accelerate, allowing the abundant K of these soils to be utilized. Banded K application, particularly with air drills, raises K levels near the growing roots at this critical time. Banding also helps prevent germination damage from salt effects, which can occur when K is placed with the seed at rates exceeding 20 lbs K2O /ac (Skogley, 1975).
Calculation Box 2
Calculation: K fertilizer to apply = K2O Recommendation/ K2O fraction in fertilizer
Example: The fertilizer recommendation is 20 lb K2O /ac. How much KCl (0-0-60) is needed?
Recall that the 60 means that this fertilizer is equivalent to 60% K2O. Expressed as a fraction, 60% =0.60 (60%/100%).
KCl needed = (20 lb/ac)/0.60 = 33 lb/acre
The recommendation for Montana and Wyoming high K soils is to apply 20 to 30 lbs K2O /acre of starter fertilizer to maximize yield and profit. In soils that do not test high for K, fertilize based on Table 3, which are generally somewhat lower levels than the crop will absorb. This strategy will continue to draw K from exchange sites, thereby utilizing the soil’s natural capacity to supply K. To determine the amount of a particular fertilizer to apply based on fertilizer recommendations, refer to Calculation Box 2.
Potassium fertilizer is available commercially as potassium chloride, potassium sulfate, and potassium nitrate (Table 4). These are all salts and have the potential for toxicity if applied in excess. Potassium chloride accounts for over 95% of all K fertilizer sold in Montana because KCl is mined in nearby Saskatchewan from raw KCl deposits. The minimal processing and transportation make this the most economic K source. The chloride (Cl) constituent of KCl has also been shown to increase yield in many parts of the state (Engel et al., 1998) and to increase disease resistance in some small grains (Engel et al., 1994). Potassium sulfate is primarily used where Cl toxicity or sulfur (S) deficiency is a problem. Chloride and S nutrient management will be discussed in later NM Modules.
Table 4. Composition of selected K fertilizers.
| Fertilizer Source | Commercial Grade | Formula |
| Potassium chloride | 0-0-60 | KCl |
| Potassium sulfate | 0-0-50 | K2SO4 |
| Potassium nitrate | 13-0-44 | KNO3 |
Summary
Effective K management in Montana and Wyoming requires not only a thorough understanding of K transformations in the soil, but also an awareness of how climate, aeration, and water can affect the ability of a plant to access the large reserves of soil K. Potassium exists in large, albeit finite, amounts in the soil, but the available forms can be depleted over long-term agricultural utilization as has been the case on many farms in the Midwest and in the East. Large amounts of K are removed from the soil during harvest, and in most parts of Montana and Wyoming replenishment of the available K pool with fertilizer amendments are minimal. Proper management and knowledge of K cycling in the soil can help maintain the present K reserve in agricultural soils and ensure it is utilized efficiently.
References
Ching, P.C. and S.A. Barber. 1979. Evaluation of temperature effects on K uptake by corn. Agron. J. 71:1040- 1044.
Brady, N.C. and R.R. Weil. 1999. The Nature and Properties of Soils. 9th Edition. Macmillan Publishing Company New York. 750 p.
CFA. 1995. Western Fertilizer Handbook. 8th ed. California Fertilizer Association. Interstate Publishers, Inc. Danville, Illinois. 338 p.
Engel, R.E., J. Eckhoff, and R.K. Berg. 1994. Grain yield, kernel weight, and disease responses of winter wheat cultivars to chloride fertilization. Agron. J. 86:891-896.
Engel, R.E., P.L. Bruckner, and J. Eckhoff. 1998. Critical tissue concentration and chloride requirements for wheat. Soil Sci. Soc. Am. J. 62:401-405.
Foth, H.D. and B.G. Ellis. 1997. Soil Fertility. CRC Press, Boca Raton, Florida. 290 p.
Havlin, J.L., J.D. Beaton, S.L. Tisdale, and W.L. Nelson. 1999. Soil Fertility and Fertilizers. 6th Edition. Prentice Hall. Upper Saddle River, NJ. 499 p.
Hoeft, R.G., E.D. Nafziger, R.R. Johnson, and S.R. Aldrich. 2000. Modern Corn and Soybean Production. MCSP Publications. Champaign, IL. 353p.
Jackson, G.D. 1998. Spring wheat response to potassium and chloride. Fertilizer Fact #18. Montana State University Extension Service.
Jackson, G.D., G.D. Kushnak, A.N. Benson, E.O. Skogley, and R.E. Lund. 1991. Potassium response in no-till small grain production. J. of Fertilizer Issues. 8:89-92.
Jacobsen, J., R. Miller, and E. Skogley. 1992. N, P, and K accumulation by hard red spring wheat. Montana AgResearch, 9:23-26.
Lawton, K. 1946. The influence of soil aeration on the growth and absorption of nutrients by corn plants. Soil Sci. Soc. Am. Proc. 10:263-268
McLean, E.O. 1978. Influence of clay content and clay composition on potassium availability. Potassium in soils and crops. Potash Institute of India.
Skogley, E.O. 1975. Potassium in Montana soils and crop requirements. Montana State University, Bozeman. 62p.
Skogley, E.O. and V.A. Haby. 1981. Predicting crop responses on high- potassium soils of frigid temperature and ustic moisture regimes. Soil Sci. Soc. Am. J. 45:533-536.
Veeh, R.H. and E.O. Skogley. 1986. Small grain response to potassium fertilizers as related to soil and site characteristics. Soil Sci. Soc. Am. J. 50:373-378.
Yang, J.E. and E.O. Skogley. 1992. Diffusion kinetics of multinutrient accumulation by mixed-bed ion- exchange resin. Soil Sci. Soc. Am. J. 56: 408-414
Appendix
Books
Western Fertilizer Handbook. 9th Edition. 2001. Soil Improvement Committee. California Fertilizer Association. Interstate Publishers. 351 p. (http://agbook.com/westernfertilizerhb.asp) $35 including shipping.
Plant Nutrition Manual. J. Benton Jones, Jr. 1998. CRC Press, Boca Raton, Florida. 149 p. Approximately $50.
Soil Fertility. Foth and Ellis. 1997. CRC Press, Boca Raton, Florida. 290 p.
Soil Fertility and Fertilizers: An Introduction to Nutrient Management. Havlin, J.L., S.L. Tisdale, J..C. Beaton and W.L. Nelson. 7th edition, 2005. Pearson Prentice Hall. Upper Saddle River, New Jersey. 515 p. approx. $100.
Extension Materials
Fertilizer Guidelines for Montana Crops (EB161), Free
Online at: http://www.montana.edu/ wwwpb/pubs/eb161.html
Or, obtain the above publication (add $1 for shipping) from:
Personnel
Engel, Rick. Associate Professor. Montana State University, Bozeman. (406) 994-5295. engel@montana.edu
Jackson, Grant. Associate Professor. Western Triangle Agricultural Research Center, Conrad. (406) 278-7707. gjackson@montana.edu
Jones, Clain. Extension Soil Fertility Specialist. Montana State University, Bozeman. (406) 994-6076. clainj@montana.edu
Westcott, Mal. Professor. Western Agricultural Research Center, Corvallis. Phone: (406) 961-3025. westcott@montana.edu
Web Resources
http://ag.montana.edu/maes/index.htm Links to Montana Agricultural Research Center home pages which report a variety of useful information specific to Montana agriculture. Source: Montana State University
http://www1.agric.gov.ab.ca/$department/deptdocs.nsf/all/agdex917?opendocument Potassium fertilizer application in crop production. Source: Alberta Ag., Food, and Rural Developement
http://www.back-to-basics.net/fertilityfacts/pdf_files/starter_potassium_wheat.pdf Starter potassium guidelines for wheat and barley in Western Canada. Source: Better Crops Magazine
http://www.ppi-far.org Potash and Phosphate Institute home page containing information about global potassium fertilization.
http://www.cas.psu.edu/docs/casdept/agronomy/forage/docs/fertility/fertilityAdoc.html Soil fertility management for forage crops. Source: Penn State University.
http://www.ext.nodak.edu/extpubs/plantsci/soilfert/sf882w.htm Fertilizer recommendation with different soil test results for several crops. Source: North Dakota State University.
http://www.montana.edu/publications Montana State University Publications ordering information for Extension materials.
http://www.unibestinc.com A source of information about the application and interpretation of soil testing using resin capsules.
http://Agnotes.org MSU weekly Agronomy Notes by Dr. Jim Bauder on range of issues, including fertilizer management.
http://landresources.montana.edu/FertilizerFacts/ Fertilizer Facts summarizing fertilizer findings and recommendations based on field research conducted in Montana by Montana State University personnel.
Acknowledgments
We would like to extend our utmost appreciation to the following volunteer reviewers who provided their time and insight in making this a better document:
Dan Long, Northern Agricultural Research Center, Hav