

Phosphorus Cycling, Testing and Fertilizer Recommendations
This module is the fourth in a series of Extension materials designed to provide Extension agents, Certified Crop Advisers (CCAs), consultants, and producers with pertinent information on nutrient management issues. To make the learning ‘active,’ and to possibly provide credits to Certified Crop Advisers, we have included questions at the back of this module. In addition, realizing that there are many other good information sources including previously developed Extension materials, books, web sites, and professionals in the field, we have provided a list of additional resources and contacts for those wanting more in-depth information about phosphorus.
Last Updated: 06/05by Clain Jones and Jeff Jacobsen
Objectives
- Understand the various soil forms of phosphorus
- Recognize how soil and climate properties affect phosphorus cycling in soil
- Recognize how cropping systems affect phosphorus management
- Be able to make a phosphorus fertilizer recommendation based on a soil test report
- Recognize the advantages and disadvantages of different phosphorus fertilizers
Background
Phosphorus (P) fertilizer is second only to nitrogen (N) in the amount applied annually to cropland in Montana. It is required for many plant functions, including energy transfer and protein synthesis. Unlike N fertilizer, which is made from virtually unlimited amounts of N2 gas in the atmosphere, commercial P fertilizer is mined from a finite supply of P ore deposits. Compared to most parts of the country, the amount of P in Montana and Wyoming soils is low. Many soils in these states show significant crop responses to P fertilization. Combined with growing environmental concerns and regulations, it is useful for agricultural professionals to more fully understand the effect that various management practices have on P availability and movement. This is accomplished in this module by
- describing the factors that affect P cycling in soils;
- explaining the usefulness of P soil tests;
- demonstrating how to make P fertilizer recommendations based on soil test results; and
- discussing pros and cons of various P fertilizer management practices.
Table 1. Definitions of each P form.
| Phosphorus Form | Example Molecular Formula | Notes |
| Phosphate | HPO4-2, H2PO4- | Form that plants can use |
| Sorbed P | — | Can slowly become available |
| Mineral P Calcium phosphates Aluminum phosphate Iron phosphate |
CaHPO4 AlPO4 FePO4 |
Relatively insoluble |
| Organic P | — | Slowly supplies available P to plants and microorganisms |
Phosphorus Cycling
Phosphorus can exist in the soil as phosphate (HPO4-2 or H2PO4-), sorbed P, organic P, or in P minerals (Table 1). Phosphate is the only form that plants can take up, yet in most agricultural soils there is less than 1 mg/L (1 ppm) of phosphate in solution, which represents much less than 1% of the total soil P. Organic P, which is P bound in organic matter, has been found to represent between about 25% and 65% of total P in surface soils, with mineral P (such as calcium phosphate minerals) and sorbed P, representing the remainder (Brady, 1984).
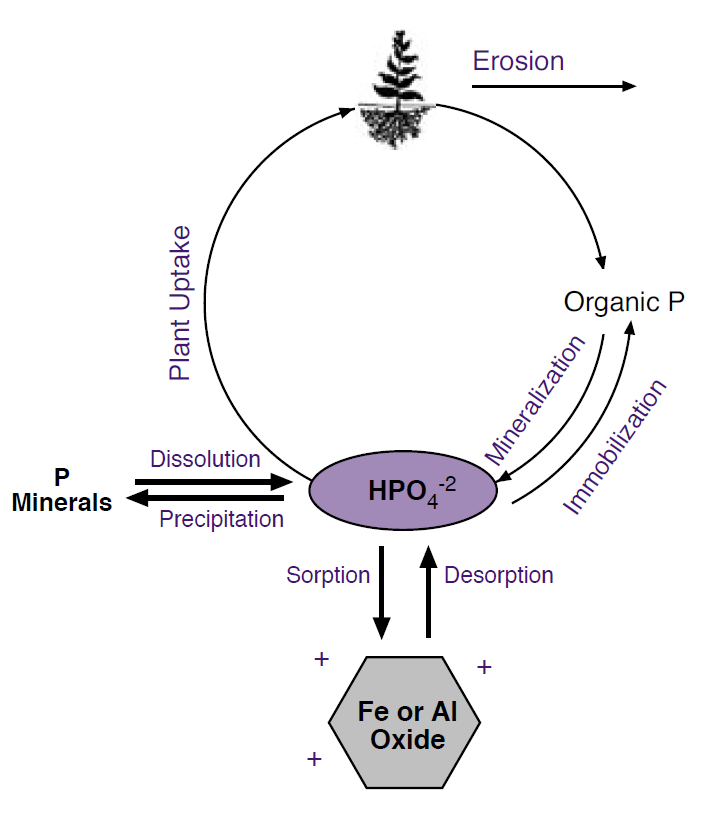
Organic P decreases quickly with soil depth, paralleling decreases in organic matter. The processes that control the amount of available P in the soil are: plant uptake, sorption, desorption, mineralization, immobilization, precipitation, dissolution, and erosion (Figure 1).
Plant Uptake
Despite low concentrations of phosphate in soil solution, plants can take up substantial amounts of P due to P desorption and dissolution (discussed below), followed by P diffusion to the plant root (Foth and Ellis, 1997). By taking up large amounts of P, a strong ‘diffusion gradient’ is created (see Nutrient Management Module 2, Plant Nutrition and Soil Fertility) which moves P toward the plant root at much higher rates than water is moving via transpiration. P uptake for selected agricultural crops ranges from about 20 to 60 lb P2O5/ac per year, although these amounts are dependent on yield (Table 2).
Commercial P fertilizers have historically been expressed as the oxide form (P2O5) rather than the elemental form (P), therefore P values are still expressed as P2O5. Using the ratio of their molecular weights, %P2O5 can be converted to %P by multiplying by 0.44 (%P = %P2O5 x 0.44). To estimate P2O5 uptake for a specific field, one can divide actual yield by the yield in Table 2 and then multiply this result by the P2O5 uptake given. This is an estimate of P fertilizer that is being removed by the crop, and may help in determining P fertilization recommendations.
A more exact method to estimate P removal is to have P analyzed in the plant tissue that will be removed from the field, and multiply the result by dry matter yield removed. The amount of P uptake is affected by the amount of available P in the soil; a quantity that is controlled by other processes involving P that are discussed below.
Figure 1. Phosphorus cycle.
Sorption/Desorption
Sorption refers to the binding of P to soil particles. Because phosphate has a negative charge, it is attracted to, and binds strongly to positively charged minerals, such as aluminum (Al) and iron (Fe) hydroxides and oxides. Recall that rust is a type of iron hydroxide. Like other soil particles, these minerals become more positively charged at lower pH; therefore, more phosphate is sorbed at lower pH (Figure 2). Finer textured soils generally can sorb more P because they have more surface area. In the calcareous soils of Montana and Wyoming, sorption is likely not as important as precipitation (discussed later) at controlling available P levels.
Table 2. P uptake amounts in harvested portions for selected agricultural crops.
| Crop | Assumed Yield Per Acre | P2O5 Uptake (lb/ac) |
| Alfalfa | 2.5 t | 28 |
| Barley | 50 bu | 30 |
| Brome | 1.5 t | 19 |
| Corn silage | 20 t | 23 |
| Oats | 60 bu | 24 |
| Orchard grass | 1.5 t | 25 |
| Potatoes | 300 cwt. | 60 |
| Sugar beets | 25 t | 50 |
| Timothy | 1.5 t | 21 |
| Wheat | 40 bu | 25 |
From Pierzynski et al. (2000) and CFA (1995).
Sorption is decreased, and hence available P levels are increased, when the soil solution contains high levels of other anions such as bicarbonate, carbonate, silicate, sulfate, or molybdate that compete for sorption ‘sites.’ In addition, dissolved organic compounds associated with organic matter can increase P availability by competing for phosphate sorption sites or coating Fe/Al oxides. In addition, as more P fertilizer is added, P sorption sites can begin to become saturated, which increases the recovery, or P use efficiency, of added P. Although Fe/Al oxides do not represent a large fraction of Montana and Wyoming soils, they are some of the only minerals that carry a substantial amount of positive charge at pH levels typical in this region, and thus can sorb large amounts of dissolved P, which is negatively charged. Sorption of P generally increases with increased temperatures in P fertilized soils, but there is no correlation with temperature in soils that have not had P added (Havlin et al., 1999). P desorption (the opposite of sorption) generally increases as solution P decreases, or under flooded conditions due to dissolution of Fe hydroxides and oxides, that release sorbed P.
Q&A #1
Is ‘sorbed P’ part of a mineral?
Actually, no. P that is sorbed is bound only to the outside of minerals, but does not become part of the mineral itself. The process you’re describing is called precipitation and is described later.
Mineralization/Immobilization
P mineralization is the process where organic P becomes converted to phosphate as organic P decomposes, and immobilization is the process where available P becomes tied up in microorganism cells. In the United States, annual amounts of P mineralization have been found to range from 4 to 22 lb P2O5/ac, representing a significant portion of crop P uptake. These values are averages from 30-80 year studies and would be expected to currently be less due to lower organic matter levels in most cultivated soils. Mineralization occurs most readily when the C:P ratio is less than 200:1, and immobilization occurs when that ratio is greater than 300:1 (Havlin et al., 1999). For comparison purposes, the C:P ratio for beef cattle manure is approximately 100:1 (St. Jean, 1997), suggesting that decomposing manure should mineralize (release) P rather than immobilize P. Mineralization and immobilization of P are affected by temperature, moisture, aeration, and pH in similar ways as N mineralization and immobilization, because they involve the same microbial processes (see Nutrient Management Module 3, Nitrogen Cycling, Testing and Fertilizer Recommendations).
Figure 2. Phosphate sorption to an iron oxide. Adapted from Havlin et al. (1999).
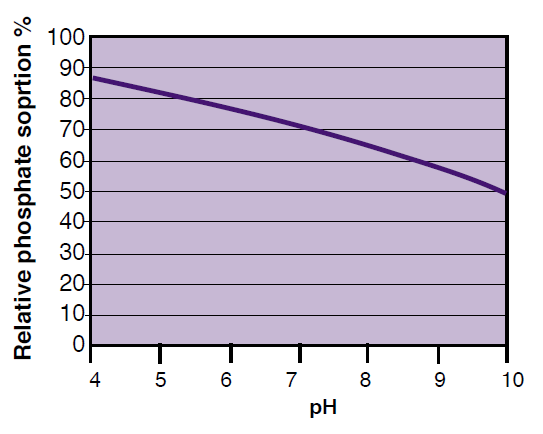
Table 3. Selected calcium phosphates.
| Ca-P Form | Time To Form Following Fertilization | Solubility |
| Monocalcium P (MCP) | minutes | Highest |
| Dicalcium P (DCP) | days to weeks | |
| Octacalcium P (OCP) | 2-5 months | |
| Tricalcium P (TCP) | 8-10 months | |
| Hydroxyapatite (HA) | 1-2 years | |
| Fluorapatite (FA) | 1-2 years | Lowest |
Precipitation/Dissolution
Available P concentrations are largely controlled by the solubility of P minerals that are dominated by calcium phosphates (Ca-P) in neutral to high pH soils typical of Montana and Wyoming soils, and by Al and Fe phosphates (Al-P and Fe-P) at pH levels below about 6.5. There are numerous forms of calcium phosphates in soil, ranging from the very soluble monocalcium phosphate (MCP) to the very insoluble fluorapatite (Table 3).
After fertilizing with P in a neutral or high pH soil, MCP will form first, followed by the other calcium phosphates in order from high to low solubility. The time for each mineral to form is highly dependent on temperature; for example, OCP formation has been found to be four-fold faster at 68o F compared to 50o F. If a soil has a mixture of the various Ca-P solids, the more soluble forms will dissolve more readily as phosphate levels in solution decrease during the growing season.
Research has found that DCP will keep soluble P levels at approximately 1.5 mg/L or ppm (at pH 7.5), whereas TCP will maintain soluble P levels at about 0.03 mg/L (Lindsay, 1979). Some research has found that P limits wheat growth at soluble P levels below 0.03 mg/L (Havlin et al., 1999); therefore, a soil could have high levels of TCP, HA, or FA, and still limit plant growth due to lack of available P. Accessing these more insoluble forms of P that are at fairly high levels in most MT and WY soils would be advantageous, although this would require either lowering Ca or pH levels, which is very difficult in calcareous soils. Decreasing pH would take large quantities of acid, or acid- producing substances such as elemental S, Fe+3, or manure.
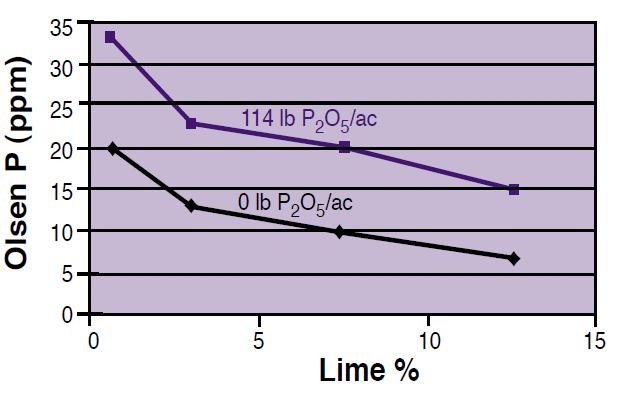
As may be expected, soils with higher levels of calcium carbonate (lime) will tie up more P due to precipitation of Ca-phosphates, and thus lower the soil test P (Figure 3). Note that the same large addition of P (114 lb P2O5/ac) increased the Olsen soil test result by about 13 ppm at 1% lime, but only 8 ppm at 12.5% lime. Therefore, higher amounts of P fertilizers are needed in soils with high amounts of lime to offset the effect of calcium phosphate precipitation. Lime concentrations may be especially high in some surface soils that have been eroded or leveled for irrigation purposes, exposing subsurface calcareous horizons.
Figure 3. The effect of soil lime concentration on Olsen P test level. Adapted from Westermann (1992).
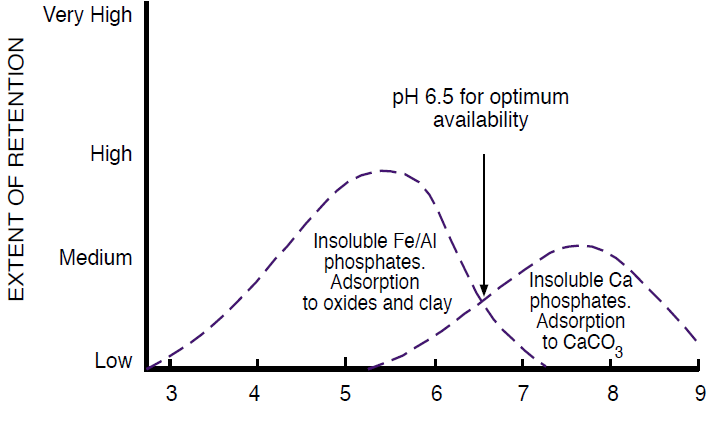
Al phosphates and Fe phosphates are the predominant P minerals in soils with pH levels below about 6.5 (Havlin et al., 1999). The solubility of these minerals decreases at lower pH, directly opposite of the solubility for calcium phosphates. Therefore, P is most available around pH 6.5, because at lower pH levels, P retention is high due to Al-P and Fe-P precipitation, and at higher pH levels, Ca-P minerals precipitate (Figure 4). Because most soils in Montana and Wyoming have pH levels closer to 8.0, we expect P availability to be relatively low. In fact, based on results from 2.5 million soil samples collected in 47 states from Fall 2000-Spring 2001, Montana had the second highest percentage (78%) of soil samples testing either medium or lower in soil test P (PPI, 2001). Wyoming was 12th with 58% testing medium or lower. Alabama had the highest percentage (79%), likely due to low soil pH levels that cause P to precipitate with Al and Fe. Although Figure 4 only focuses on the effect of pH on P availability, warmth and moisture also increase P availability.
Figure 4. The effect of soil pH on P retention and availability. From Havlin et al. (1999).
In a study looking at the long term effects (>20 years) of P fertilization and cropping on a dryland wheat-fallow system in Montana, total P in the upper 6 inches was found to be approximately 15% higher in the fertilized soil than in the control, whereas available P (Olsen P) was nearly 50% lower (Jones et al., 2002). This demonstrates that fertilization can increase total P without increasing available P, likely due to precipitation of relatively insoluble Ca-P minerals.
Q&A #2
Much more P is applied to a certain field each year than removed by a particular crop, yet the P test levels stay low. Where’s the P going?
The added P is likely precipitating into insoluble P minerals, or is being sorbed strongly to the soil. With large annual applications of P, the soil test P should eventually increase over time, although applying the P fertilizer with the seed will increase the odds that the crop can use it. In addition, adopting practices that increase organic matter should produce more mineralized P, and hence increase soil test P.
Erosion and Runoff
Soil erosion represents a loss of P from agricultural fields and can occur from water or wind because P is generally bound so tightly to the soil. Although low rainfall and relatively flat topography in agricultural valleys of Montana and Wyoming prevent high amounts of erosion from water, total annual erosion from most of Eastern Montana is quite high (8 to 16 tons/acre), largely due to wind (USDA, 1994). Assuming a typical total P concentration of 500 ppm, this equates to 18 lb P2O5 /ac per year, a substantial loss in the overall P budget. Some eroded soil from upwind or upstream may be deposited to replace a portion of that lost, although rarely is the redistribution of eroded soil uniform as much of it is deposited at the edge of fields or in ditches. Some factors contributing to high amounts of soil erosion include: 1) long slopes in fields farmed without runoff diversions, 2) rows planted up and down moderate or steep slopes, 3) inadequate crop residue, 4) lack of buffer strips, 5) poor stands, 6) lack of windbreaks, 7) intensive tillage, and/or 8) overirrigation.
Dissolved P in runoff can represent another loss of P from agricultural fields. However, the concentration of dissolved P in runoff is generally low due to the high amount of sorption and precipitation of P minerals. One exception to this general rule is animal manure stockpiles or manure application sites, where P is concentrated and sorption sites in the manure and surrounding soil may be approaching saturation. For example, soluble P has been found to approach 80 mg/L (ppm) in runoff from pastures fertilized with poultry manure (Pierzynski et al., 2000).
In another study, dairy manure applications of 100 lb P2O5 /ac increased P in runoff by up to six-fold (Sharpley and Tunney, 2000). With relatively new environmental regulations and guidelines involving Total Maximum Daily Loads (TMDLs) and Nutrient Management Plans (NMPs), it is important to realize that the general perception that P binds strongly to soil is true only to a certain soil P level or application amount. So, how do we know where this point is without collecting a water sample leaving a field? A large amount of research has correlated soil test P levels with dissolved P in soil solution, drainage water, or runoff. One of these studies found that P in solution began to significantly increase only when Olsen P levels were above 60 ppm (Heckrath et al., 1995). Therefore, maintaining Olsen P levels between the critical level and this threshold should optimize yield without losing substantial quantities of P in runoff.
Preventing surface loss of P from erosion or runoff can be attained through no-till, conservation tillage, windbreaks, improved soil fertility, minimal residue burning, winter cover crops, runon/runoff control, and buffer strips, among others. Your local Natural Resource Conservation Service (NRCS) office can offer numerous solutions for decreasing soil erosion and runoff, and hence loss of P.
Leaching
Leaching was not shown on the P cycle (Figure 1) because it does not occur very readily in most soils. One 20-plus year study in Wisconsin found that P from commercial fertilizers had not moved more than 5 cm below the plow layer, and P from manure applications had moved less than 20 cm below the plow layer (Meyer et al., 2001). The higher movement of P associated with manure is likely due to the effects that organic materials have on sorption, as described previously. In sandy soils, commercial fertilizer applications have been found to increase available P concentrations up to 3 feet below the surface, but to have no effect on available P at 4.5 feet below the surface (Pierzynski et al., 2000). A three-year study in Wyoming on a sandy clay loam, found that a very high irrigation rate (3 feet per season) leached P to approximately 4.5 feet (Peterschmidt et al., 1979). Therefore, P leaching is probably only a concern in Montana and Wyoming on coarse soils that are either frequently flood-irrigated or have had long-term, high rate manure applications.
Table 4. Available P gains and losses in the soil.
| Gains | Losses |
| Fertilizer/Manure | Plant uptake |
| Desorption | Sorption |
| Mineralization | Immobilization |
| Dissolution | Precipitation |
| Erosion |
P Budget
We have now looked at each of the inputs and each of the outputs to the available P pool. A summary of this available P budget is shown in Table 4. A total P budget can also be constructed for a specific field based on total P inputs and outputs. This exercise can be helpful in determining if soil P levels are increasing or decreasing. Unlike the N budget, where gains and losses from the atmosphere are virtually impossible to measure, a P budget is fairly easy to construct. The only major total P inputs are fertilizer and animal manure, and the only major total P output is crop removal, which can be estimated from Table 2 or calculated directly from tissue P concentration and dry matter yield. Cropland with initially low levels of available P will likely show increased total P levels as P fertilizer is applied to increase yields. Conversely, in soils with moderate to high levels of available P, the soil may be “mined” of P until yields are negatively impacted. Manure-applied fields will almost always show an increase in total P, due to high concentrations of P in manure. An accumulation of P may not be a problem if runoff and erosion from the area are minimal, although very high levels of P have been found to cause zinc deficiencies in some crops (Havlin et al., 1999). By comparing annual P application rates with soil P test results (discussed below) for a certain field, the effect of fertilization amounts on P availability can be determined.
Q&A #3
How do I convert Bray-P to Olsen-P?
Some researchers have used formulas such as: Olsen-P = Bray-P/1.5; however, the constant of 1.5 is very dependent on soil conditions, particularly pH. For example, in one study in Montana, it was found that at pH 8, Olsen-P = Bray-P/0.5, whereas at pH 5.6, Olsen-P = Bray-P/2 (Jones et al., unpub. data). Instead of converting, you should ask your lab to run Olsen-P if your soil has a pH above 7, or use fertilizer-yield response curves for Bray-P. Montana fertilizer guidelines base fertilizer recommendations on a ?at ‘soil test P’ and make the assumption that high pH soils are extracted with the Olsen method, and acidic soils are extracted with the Bray method.
P Soil Testing
The primary goal of soil testing for P is to determine P fertilizer requirements for a specific crop. The mechanics of soil testing have been previously described (Nutrient Management Module 1). Soil samples for P analysis are generally collected from the upper 6 inches because P from fertilizers will stay in this upper layer due to strong sorption and precipitation. In addition, P fertilizer recommendations are generally based on results from this upper 6 inches. Unlike N, simply measuring dissolved P will not give an adequate estimate of P availability. Therefore, extractions have been developed which are designed to remove the more readily available sorbed and mineral P fractions (Table 5). The Bray-1 and Mehlich-3 tests were developed for acidic soils, and work by dissolving the more soluble Al-P and Fe-P minerals that control phosphate concentrations in acidic soils. The Olsen P test was developed for neutral to high pH soils, and relies on the bicarbonate extractant to dissolve the more soluble Ca-P minerals and release some sorbed P.
Table 5. Selected soil P tests and extractants.
| Test | Extractants |
| Olsen | NaHCO3 at pH 8.5 |
| Bray-1 | HCl, NH4F |
| Mehlich-3 | NH4F, CH3COOH, NH4Cl/HCl |
Another promising soil test technique is using anion exchange resins, either encapsulated in a synthetic mesh or in a probe. The advantage of a resin over an extractant is that the resin better imitates a plant root by decreasing solution P, promoting P desorption and dissolution. Research in Montana on P-responsive calcareous soils has found that Resin-P is more responsive than Olsen-P to changes in P availability following P fertilization (Yang et al., 2002). The disadvantage is that there has been insuf?cient calibration of the resin P results against yield to enable a fertilizer recommendation to be made.
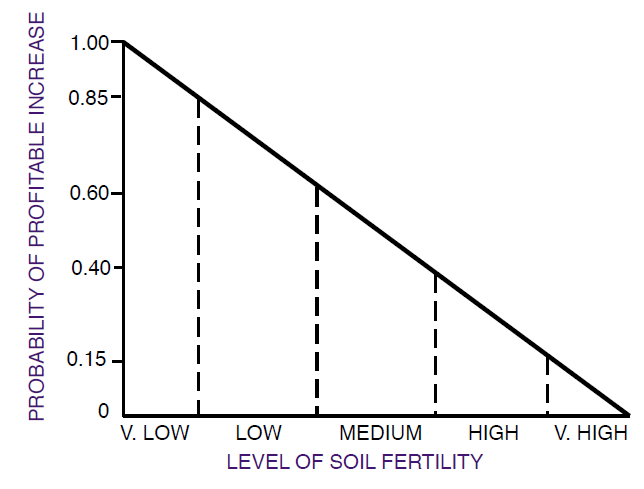
A large amount of research has been conducted to determine relationships between P soil test results and relative yields. The general relationship between soil test P levels and yield is shown in Figure 5. Soil test levels are generally broken into low, medium, or high, and sometimes also into ‘very low’ or ‘very high’. At soil test P levels above the ‘critical level’ only minimal yield responses can be expected. The critical level will vary with crop and climate; for example, the critical level for spring wheat is approximately 16 ppm (Jackson et al., 1997) and for winter wheat is approximately 24 ppm (Jackson et al., 1991). In addition, because there are so many factors that affect P availability and yield, fertilizing a soil that has a medium P test level increases the probability that there will a yield response, but does not guarantee a yield response (Figure 6). Conversely, there is still some chance that fertilizing a soil with a high soil test P level will produce a profitable yield increase. Specifically, in some calcareous Montana soils, significant growth responses to P fertilization are sometimes observed in small grains when the Olsen P level is above the critical level (Jackson et al., 1991; Jackson et al., 1997; Yang and Jacobsen, 1990). Therefore, testing yield responses to P fertilization on specific fields is recommended to supplement and validate soil test results. In addition, starter P with or near the seed will usually provide some faster growth earlier in the spring growing season when soils are cool and wet.
Figure 5. Effect of soil test P level on crop yield.
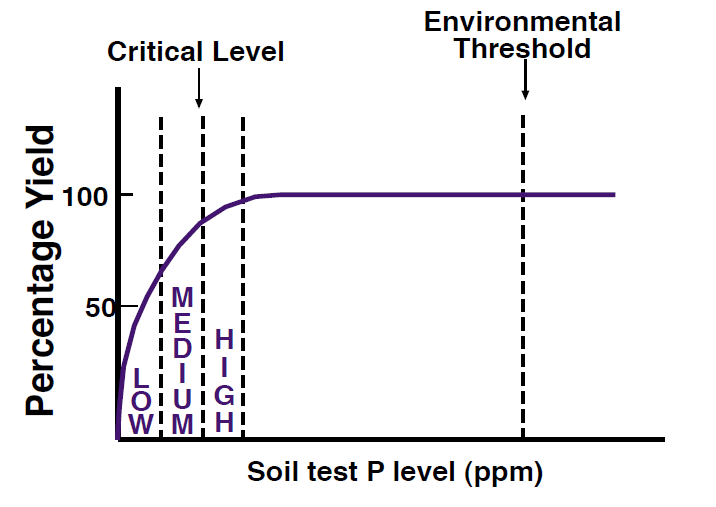
Figure 6. The effect of soil test level on the probability of a pro?table yield increase from fertilization. A probability of 0.85 means an 85% chance. From Havlin et al. (1999).
At P levels above the ‘environmental threshold’ there may be water quality degradation, although there is no agreement on what this threshold should be. The environmental threshold is primarily a regulatory criteria and varies from state to state. It is generally 2 to 4 times higher than the critical level. In Montana and Wyoming, there currently is no set threshold, although the federal NRCS Waste Utilization guidelines recommend no animal manure applications if the soil test P level is above 150 ppm and manure application rates cannot exceed crop P removal rates if the test level is above 100 ppm. Idaho uses an environmental threshold for Olsen-P of 50 ppm on sandy soils and 100 ppm for silt loam soils (Sharpley and Tunney, 2000). One recognized problem with environmental thresholds is that they do not take into account the potential for erosion or runoff from the site, so are not a good predictor of P loss from a field (Sharpley and Tunney, 2000). Due to this concern, the USDA has developed a ‘P index’ tool that considers erodibility, runoff, soil test P result, P application rate, and P application method. The tool requires veri?cation, but is one possible method for estimating the potential for surface P loss. For more information about determining and using the P index see the NRCS website listed in the appendix.
P Fertilizer Recommendations
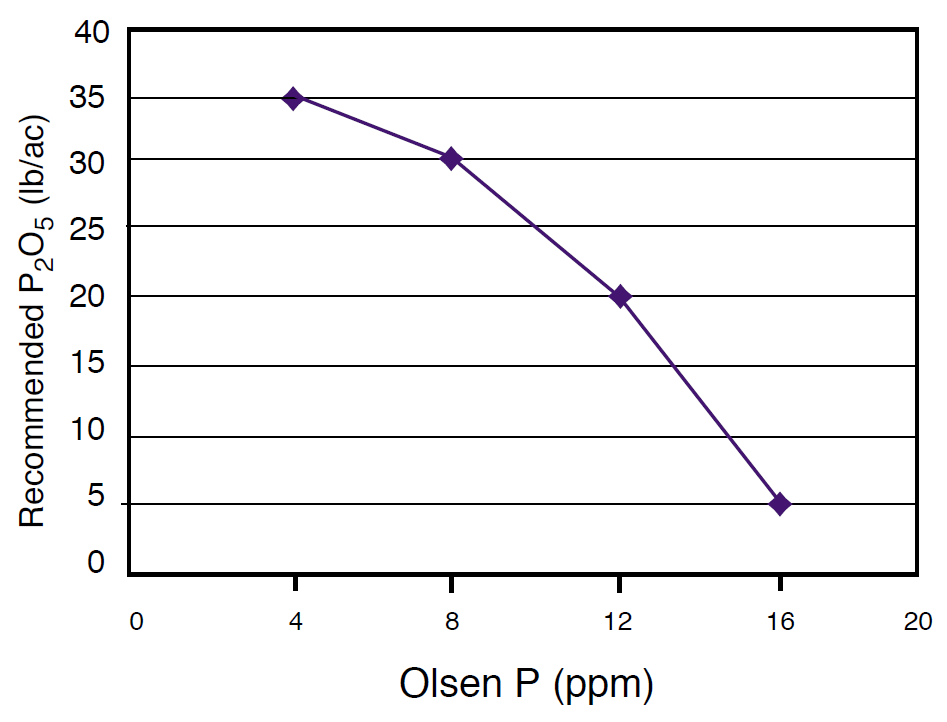
Soil analytical laboratories often provide a recommended P application amount based on soil P test results. However, producers may alter this amount depending on fertilizer costs, changes in yield potential, management intensity, or due to different philosophies (sufficiency or maintenance/build-see Nutrient Management Module 1). P fertilizer guidelines are useful for determining a P fertilizer requirement. As an example, fertilizer P recommendations for grass are provided from the MSU Fertilizer Guidelines for Montana Crops (EB 161), which uses a sufficiency approach (Figure 7). Note that if the soil test P level is 8 ppm, these guidelines would recommend applying 30 lb P2O5/ac. This value could be adjusted upward slightly for high yield goals and slightly downward for low yield goals. A typical grass yield in Montana is approximately 1.5 t/ac which would take up approximately 22 lb P2O5/ac (Table 2), suggesting that the remaining 8 lb P2O5/ac would be bound to the soil. Table 21 of EB 161 can be used to estimate P2O5 removal amounts of major Montana crops for those wishing to use a build/maintenance approach for P fertilization (NM 1). Specifically, the removal amount can be added to the sufficiency amount (Table 18 of EB 161) to determine the P fertilizer rate in order to build the soil test P level until it reaches the critical level. See the Calculation Box for converting between P2O5 and P fertilizer amounts. By plotting annual soil test levels, P fertilization amounts, and yield, one can begin to determine how P fertilization amounts affect both yield and soil test levels for a particular field. This may prove more fruitful than using published guidelines, because it is speci?c to your area, crop variety, and management practices.
Figure 7. P fertilizer recommendations based on soil test P level for grass (from Extension Bulletin 161).
Phosphorus Fertilizer Management
Proper management of P fertilizer applications is key to optimizing yield and protecting water quality. As mentioned previously, practices that increase P availability include banding, increasing organic matter through manure applications or conservation tillage practices, and applying fertilizers as close to peak crop uptake as possible. Some adaptations should also occur with annual versus perennial crops. In addition, it was pointed out that preventing erosion and keeping soil P levels below environmental thresholds are the best way to decrease P losses from fields. The following summarizes some additional steps that can be taken to increase P availability where needed, and decrease the potential for surface losses of P.
Calculation Box
CALCULATION: P FERTILIZER TO APPLY = P2O5 RECOMMENDATION/ P2O5 FRACTION IN P FERTILIZER
Example: The fertilizer requirement is 14 lb P2O5/ac. How much MAP (11-52-0) is needed?
Recall that the 52 means that this fertilizer is equivalent to 52% P2O5. Expressed as a fraction, 52%=0.52 (52%/100%).MAP needed = (14 lb/ac)/0.52 = 27 lb/acre
Fertilizer Type
The two most frequently used P commercial fertilizers in Montana are MAP (monoammonium phosphate) and DAP (diammonium phosphate). MAP may be temporarily more available in high pH soils, because it lowers pH, whereas DAP raises the pH. Speci?cally, in a water solution, dissolved MAP will result in a pH of 3.5, while DAP will cause a pH of 8.5 (Havlin et al., 1999). The acidic pH immediately surrounding a MAP granule should temporarily decrease the amount of P minerals that form, and may dissolve some P minerals already present in the soil. This effect is temporary, as neutralizing reactions will quickly return the pH to near a pre-fertilization level. Agronomically speaking, at the same rate of P there should be no difference in crop response between MAP and DAP for a crop that is limited by lack of available P. Nitrification of the ammonium in both MAP and DAP will also cause a slight decrease in pH (Nutrient Management Module 3); a potential benefit in high pH soils.
Fertilizing with either MAP or DAP is preferable to fertilizing with triplesuperphosphate (0-45-0 or TSP) because there is evidence that NH4+ increases P uptake (Havlin et al., 1999) and both MAP and DAP are less expensive. However, when fertilizing legumes, such as alfalfa, with very high rates of P (150 lb P2O5/acre and higher), TSP is preferable because the legume does not need the N, and the additional N may favor grasses and weeds. Liquid ammonium polyphosphate (10-34-0) is quickly converted to phosphate, and thus will undergo similar sorption and precipitation reactions as other phosphate fertilizers (Havlin et al., 1999). Rock phosphate, which is comprised of apatite and fluorapatite, is used only infrequently due to the low solubility of these two minerals, especially at high pH. Organic producers frequently use this form of raw, unprocessed P as a nutrient source, but at very high rates and pulverized into as small of pieces as possible, due to its low available P concentration and solubility.
Timing/Placement
P sorption and precipitation are relatively fast processes, happening in minutes to weeks after P fertilizers dissolve. Therefore, P fertilizer should be applied as close to the time of maximum P uptake as possible. In addition, P banding is recommended over broadcast applications because banding essentially saturates the soil with P in a small area, allowing easy access by plant roots. Conversely, if P is broadcast and incorporated, P will come in contact with much more soil surface area, leading to high levels of P sorption and low levels of available phosphate. Still, in established perennial forages, where surface broadcast application of P fertilizer is the only feasible application method, fertilization with 100 lb P2O5/ac resulted in a 35% yield increase in a Montana soil with a low available P level (Wichman, 2001). Keep in mind that mineral P and sorbed P can become available if phosphate levels in solution become low enough to promote P dissolution or desorption; however, these can be slow processes (see Nutrient Management Module 2 for more discussion).
Fertilizer Source
The source of rock phosphate used to make P fertilizers has been found to somewhat affect P uptake and yield, due to different levels of P-containing impurities that form during the manufacture of P fertilizers (Bartos et al., 1992). The percentage of a fertilizer that is water- soluble has also been shown to affect yield, although this is accounted for in the P2O5 analysis shown on the bag (e.g. 10-48-0). In addition, there are
a few concerns that dust-control coatings applied to P fertlizers may affect P solubility; however, recent research has demonstrated that coatings did not signi?cantly decrease Olsen P levels, P uptake, or above ground biomass of corn for two different sources of MAP (Jones and Jacobsen, 2002).
Table 6. Effect of manure application and soil test P level, on dissolved P (mg/L) in runoff two weeks after manure application.
| SOIL TEST P LEVEL (ppm) | NO MANURE |
100 LB
P2O5/AC
|
200 LB
P2O5/AC
|
| 69 | 0.25 | 1.35 | 2.42 |
| 237 | 0.65 | 1.40 | 2.45 |
From Sharpley and Tunney (2000).
Soil Moisture
Soils at field capacity dissolve approximately 50-80% of P fertilizer in 24 hours compared to 20-50% for soils at 2-4% moisture (Havlin et al., 1999). These differences likely do not have much effect on P availability during peak P uptake periods because both moisture contents would result in complete dissolution within a few days. However, moister soils will better promote P diffusion to plant roots.
Application Rate
Due to the soil’s high ability to sorb and precipitate P, small P applications may not substantially increase P availability. Instead, larger applications of P may be necessary to saturate soil binding sites, and increase P availability. For example, 23 months after a P banding experiment was conducted, the soil P test result one inch away from the center of the band increased by only 20% for a 45 lb P2O5/ac application, but by almost 100% for a 75 lb P2O5/ac application (Havlin et al., 1999). Therefore, there may be economic advantages to higher, less frequent, P fertilizer applications, although this has not been documented in Montana or Wyoming.
Manure Applications
Applying manure to cropland presents very different management options from those discussed above. If manure is applied to meet crop N needs, much more P is applied than is necessary to meet P needs. Therefore, long-term manure applications may increase soil test P levels well above critical levels, and possibly above environmental thresholds. Manure should be incorporated as soon as possible after application to reduce nutrient runoff potential. Other practices to decrease P in runoff include applying manure when there is no threat of rain, minimizing application amounts when possible, and applying on low slopes, among others. Application rates were found to affect P levels in runoff much more than initial soil test levels when 1 inch of precipitation fell 2 weeks after manure application (Table 6).
Manure management has become more of an issue in the last few decades as crop and animal operations have become concentrated in different regions of the country. Environmental concerns related to confined animal feeding operations (CAFOs) have been more of a problem in states in the Midwest and East Coast. However, there are fields in Montana and Wyoming where the NRCS recommends either no manure application or limited applications because of high soil P test levels. For example, when the soil test P level is between 25 and 100 ppm, the NRCS recommends that P application rates not exceed crop phosphorus needs if the ‘P index’ is high or very high. Otherwise, manure can be applied to meet crop N needs. In addition, manure applications are also based on N crop needs if the soil test level is below 25 ppm. The NRCS has hardcopy and online worksheets for P fertilizers (Bartos et al., 1992). The percentage of a fertilizer that is water- soluble has also been shown to affect yield, although this is accounted for in the P2O5 analysis shown on the bag (e.g. 10-48-0). In addition, there are a few concerns that dust-control coatings applied to P fertilizers may affect P solubility; however, recent research has demonstrated that determining manure application rates and computing a P index if necessary (see Web Resources in Appendix for NRCS website address).
Summary
Proper management of P is essential due to high crop needs, decreasing supplies of high quality rock phosphates, and increased environmental concerns and regulations. Phosphorus cycling is somewhat simpler than for N, due to lack of a major gaseous phase. The vast majority of P in soils is unavailable to plants because it is bound in insoluble P minerals and/or sorbed strongly. P availability is measured with one of three major soil tests: Olsen, Bray, or Mehlich. Generally, the Olsen test is recommended at neutral to high pH levels, and the Bray and Mehlich tests are recommended for acid soils. The goal of sound P management is to keep the soil test level near or above critical levels for maximum crop yield, yet below environmental thresholds.
Due to high amounts of P precipitation and sorption in soil, it is dif?cult to increase the amount of P available for plant uptake. However, P uptake can be increased substantially by applying high rates of banded P, using ammonium based phosphate fertilizers, and taking steps to increase soil organic matter. In Montana and Wyoming, natural levels of available P are low, decreasing the likelihood for P transport via surface runoff or leaching. However, soils in feedlots and from ?elds that have had long-term manure applications may have elevated levels of available P, and therefore, these specific cases deserve extra attention to minimize possible P losses.
References
Bartos, J.M., G.L. Mullins, J.C. Williams, F.J. Sikora, and J.P. Copeland. 1992. Water-insoluble impurity effects on phosphorus availability in monoammonium phosphate fertilizers. Soil Sci. Soc. Am. J. 56:972- 976.
Bauder, J.W., S. Mahmood, B.E. Schaff, D.J. Sieler, J.S. Jacobsen, and E.O. Skogley. 1997. Effect of phosphorus soil test level on sorghum-sudangrass response to phosphorus fertilizer. Agron. J. 89:9-16.
Brady, N.C. 1984. The Nature and Properties of Soils. 9th Edition. Macmillan Publishing Company New York. 750 p.
CFA. 1995. Western Fertilizer Handbook. 8th ed. California Fertilizer Association. Interstate Publishers, Inc. Danville, Illinois. 338 p.
Foth, H.D. and B.G. Ellis. 1997. Soil Fertility. 2nd Ed. CRC Press. Boca Raton, Florida. 290 p.
Havlin, J.L., J.D. Beaton, S.L. Tisdale, and W.L. Nelson. 1999. Soil Fertility and Fertilizers. 6th Edition. Prentice Hall. Upper Saddle River, NJ. 499 p.
Heckrath, G., P.C. Brookes, P.R. Poulton, and K.W.T Goulding. 1995. Phosphorus leaching from soils containing different phosphorus concentrations in the Broadbalk experiment. J. Environ. Qual. 24:904- 910.
Jackson, G.D., G.D. Kushnak, G.R. Carlson, D.M. Wichman, and J.S. Jacobsen. 1991. Correlation of the Olsen phosphorus soil test: Winter wheat response. Comm. Soil Sci. Plant Anal. 22: 907-918.
Jackson, G.D., G.D. Kushnak, G.R. Carlson, and D.M. Wichman. 1997. Correlation of the Olsen phosphorus soil test: Spring wheat response. Comm. Soil Sci. Plant Anal. 28:813- 822.
Jones, C.A., and J.S. Jacobsen. 2002. Effects of dust control coatings on P dissolution and uptake. In A.J. Schlegel (ed.) Proceedings of the Great Plains Soil Fertility Conference. Vol 9. Denver, Colorado. March 5-6, 2002. www.ppi-ppic.org.
Jones, C.A., J. Jacobsen, and S. Lorbeer. 2002. Metal concentrations in three Montana soils following 20 years of fertilization and cropping. Comm. Soil Sci. Plant Anal. In press.
Lindsay, W.L. 1979. Chemical Equilibria in Soils. John Wiley & Sons, New York. 449 p.
Meyer, J.M., J.W. Lyne, M. Avila-Segura, and P. Barak. 2001. Vertical redistribution of phosphorus: mining new phosphorus data from old fertility plots. Abstract. Soil Science Society of America Proceedings. ASA-CSSA-SSSA Annual Meetings - October 21 - 25, 2001. Charlotte, NC.
Peterschmidt, N.A., R.H. Delaney, and M.C. Greene. 1979. Effects of overirrigation on growth and quality of alfalfa. Ag. Jour. 71: 752-754.
Pierzynski, G.M., J.T. Sims, and G.F. Vance. 2000. Soils and Environmental Quality. CRC Press. Boca Raton, Florida. 459 p.
PPI. 2001. Soil test levels in North America. PPI/PPIC/FAR Technical Bulletin 2001-1. www.ppi-ppic.org.
Sharpley, A., and H. Tunney. 2000. Phosphorus research strategies to meet agricultural and environmental challenges in the 21st century. J. Environ. Qual. 29:176-181.
St. Jean, R. 1997. On-farm manure composting techniques-understanding nitrogen and carbon conservation. Prepared for Agriculture and Agri- Food Canada, Research Branch, COESA Report No. RES/MAN-003/97. http://res2.agr.ca/london/gpres/download/rep1_3.pdf
USDA. 1994. National Resource Inventory. United States Department of Agriculture. Washington. D.C.
Westermann, D.T. 1992. Lime effects on phosphorus availability in a calcareous soil. Soil Sci. Soc. Am. J. 56:489-494.
Wichman, D. 2001. Fertilizer use on dryland perennial forages. Fertilizer Fact Sheet 27. Montana State University Extension Service and Agricultural Experiment Station. Bozeman, MT.
Yang, J.E., and J.S. Jacobsen. 1990. Soil inorganic phosphorus fractions and their uptake relationships in calcareous soils. Soil Sci. Soc. Am. J. 54:1666-1669.
Yang, J.E., C.A. Jones, J.J. Kim, and J.S. Jacobsen. 2002. Soil inorganic P fractions and Olsen-P in P-responsive calcareous soils: Effects of fertilizer amount and incubation time. Comm. Soil Sci. Plant Anal. In press.
Other Resources
Books
Western Fertilizer Handbook. 9th Edition. 2001. Soil Improvement Committee. California Fertilizer Association. Interstate Publishers. 351 p. (http://agbook.com/westernfertilizerhb.asp) $35 including shipping.
Plant Nutrition Manual. J. Benton Jones, Jr. 1998. CRC Press, Boca Raton, Florida. 149 p. Approximately $50.
Soil Fertility. Foth and Ellis. 1997. CRC Press, Boca Raton, Florida. 290 p.
Soil Fertility and Fertilizers: An Introduction to Nutrient Management. Havlin, J.L., S.L. Tisdale, J..C. Beaton and W.L. Nelson. 7th edition, 2005. Pearson Prentice Hall. Upper Saddle River, New Jersey. 515 p. approx. $100.
Extension Materials
Fertilizer Guidelines for Montana Crops (EB161), single copy is free.
Online at: http://www.montana.edu/wwwpb/pubs/eb161.html
or, obtain the publication from MSU Extension Publications (add $1 for shipping):
See Web Resources below for online ordering information.
Personnel
Engel, Rick. Associate Professor. Montana State University, Bozeman. (406) 994-5295. engel@montana.edu
Jackson, Grant. Associate Professor. Western Triangle Agricultural Research Center, Conrad. (406) 278-7707. gjackson@montana.edu
Jones, Clain. Extension Soil Fertility Specialist. Montana State University, Bozeman. (406) 994-6076. our store, contact your county or reservation MSU Extension office, or e-mail orderpubs@montana.edu.
Copyright © 2023 MSU Extension
We encourage the use of this document for nonprofit educational purposes. This document may be reprinted for nonprofit educational purposes if no endorsement of a commercial product, service or company is stated or implied, and if appropriate credit is given to the author and MSU Extension. To use these documents in electronic formats, permission must be sought from the Extension Communications Coordinator, 115 Culbertson Hall, Montana State University, Bozeman, MT 59717; E-mail: publications@montana.edu
The U.S. Department of Agriculture (USDA), Montana State University and Montana State University Extension prohibit discrimination in all of their programs and activities on the basis of race, color, national origin, gender, religion, age, disability, political beliefs, sexual orientation, and marital and family status. Issued in furtherance of cooperative extension work in agriculture and home economics, acts of May 8 and June 30, 1914, in cooperation with the U.S. Department of Agriculture, Cody Stone, Director of Extension, Montana State University, Bozeman, MT 59717