Plant Nutrition and Soil Fertility
This module is the second in a series of Extension materials designed to provide information on a variety of nutrient management issues to Extension agents, Certified Crop Advisers (CCAs), consultants, and producers. The Appendix at the end of this bulletin lists additional resources.
Last Updated: 09/16by Clain Jones, MSU Extension Soil Fertility Specialist; and Kathrin Olson-Rutz, Research Associate
OBJECTIVES
- After reading this module, the reader should:
- Know the 17 elements essential for plant nutrition.
- Know the macronutrients and micronutrients.
- Be familiar with the function and mobility of nutrients within plants.
- Understand the forms of each nutrient that are taken up by plants.
- Be familiar with typical nutrient plant concentrations.
- Be able to specify how nutrient needs change during the growing season.
- Understand the basics of nutrient uptake.
- Know how nutrients are held or released by the soil.
BACKGROUND
Plants require 17 nutrients, also called ‘essential elements’, which assist with different plant functions for growth and reproduction. Each plant nutrient is needed in different amounts and varies in how mobile it is within the plant and the soil. It is useful to know the relative amount of each nutrient that is needed by a crop in making fertilizer recommendations. In addition, understanding plant functions and mobility within the plant are useful in diagnosing nutrient deficiencies. Soil characteristics that affect nutrient availability to plants are also presented, as they influence nutrient management decisions.
PLANT NUTRITION
ESSENTIAL ELEMENTS
There are over 100 chemical elements, yet scientists have found that only 17 of them are essential for plant growth (Table 1). To be classified as essential, the element needs to meet the following criteria:
- The plant cannot complete its life cycle (seed to new seed) without it.
- The element’s function cannot be replaced by another element.
- The element is directly involved in the plant’s growth and reproduction.
- Most plants need this element to survive.
The fourth criterion is used because some specific plants need certain elements. For example, cobalt (Co) is required by bacteria responsible for nitrogen (N) fixation in legumes; therefore, Co is classified as ‘beneficial’, rather than essential. Silica (Si) is not ‘essential’, but highly ‘beneficial’ to help plants cope with multiple stresses. Other beneficial elements include sodium (Na) and vanadium (V). Essentiality is generally determined by growing plants in nutrient solutions with or without a specific element, and observing differences in plant growth or function. Bear in mind that this approach is problematic for elements that may be required in only trace amounts, due to the difficulty in keeping all of a certain trace element out of the seed-nutrient solution, especially when plant seeds contain substantial amounts of many elements. It is possible that other elements essential for growth will be discovered at some point.
A limited supply of one of the essential nutrients can limit crop yield, although other factors such as heat or water can also limit yield. The concept that one factor will generally limit yield, or the ‘law of the minimum’, is illustrated in Figure 1, where the height of water in the barrel represents crop yield. In this figure N is initially the factor that limits yield, but after N is supplied, phosphorus (P) levels control yield.
TABLE 1. Essential element, role in plant, and source.
| Element | Role in Plant | Source |
| Carbon (C) | Constituent of carbohydrates; necessary for photosynthesis | Air |
| Hydrogen (H) | Maintains osmotic balance; important in numerous biochemical reactions; constituent of carbohydrates | Water |
| Oxygen (O) | Constituent of carbohydrates, necessary for respiration | Air/Water |
| Nitrogen (N) | Constituent of proteins, chlorophyll and nucleic acids | Air/Soil |
| Phosphorus (P) | Constituent of many proteins, coenzymes, nucleic acids and metabolic substrates; important in energy | Soil |
| Potassium (K) | Involved with photosynthesis, carbohydrate translocation, protein synthesis, etc. | Soil |
| Calcium (Ca) | A component of cell walls; plays a role in the structure and permeability of membranes | Soil |
| Magnesium (Mg) | Enzyme activator, component of chlorophyll | Soil |
| Sulfur (S) | Important component of plant proteins | Soil |
| Boron (B) | Believed to be important in sugar translocation and carbohydrate metabolism | Soil |
| Chlorine (Cl) | Involved with oxygen production in photosynthesis | Soil |
| Copper (Cu) | A catalyst for respiration; a component of various enzymes | Soil |
| Iron (Fe) | Involved with chlorophyll synthesis and in enzymes for electron transfer | Soil |
| Manganese (Mn) | Controls several oxidation-reduction systems and photosynthesis | Soil |
| Molybdenum (Mo) | Involved with nitrogen fixation and transforming nitrate to ammonium | Soil |
| Nickel (Ni) | Necessary for proper functioning of the enzyme, urease, and found to be necessary in seed germination | Soil |
| Zinc (Zn) | Involved with enzyme systems that regulate various metabolic activities | Soil |
NON-MINERAL NUTRIENTS
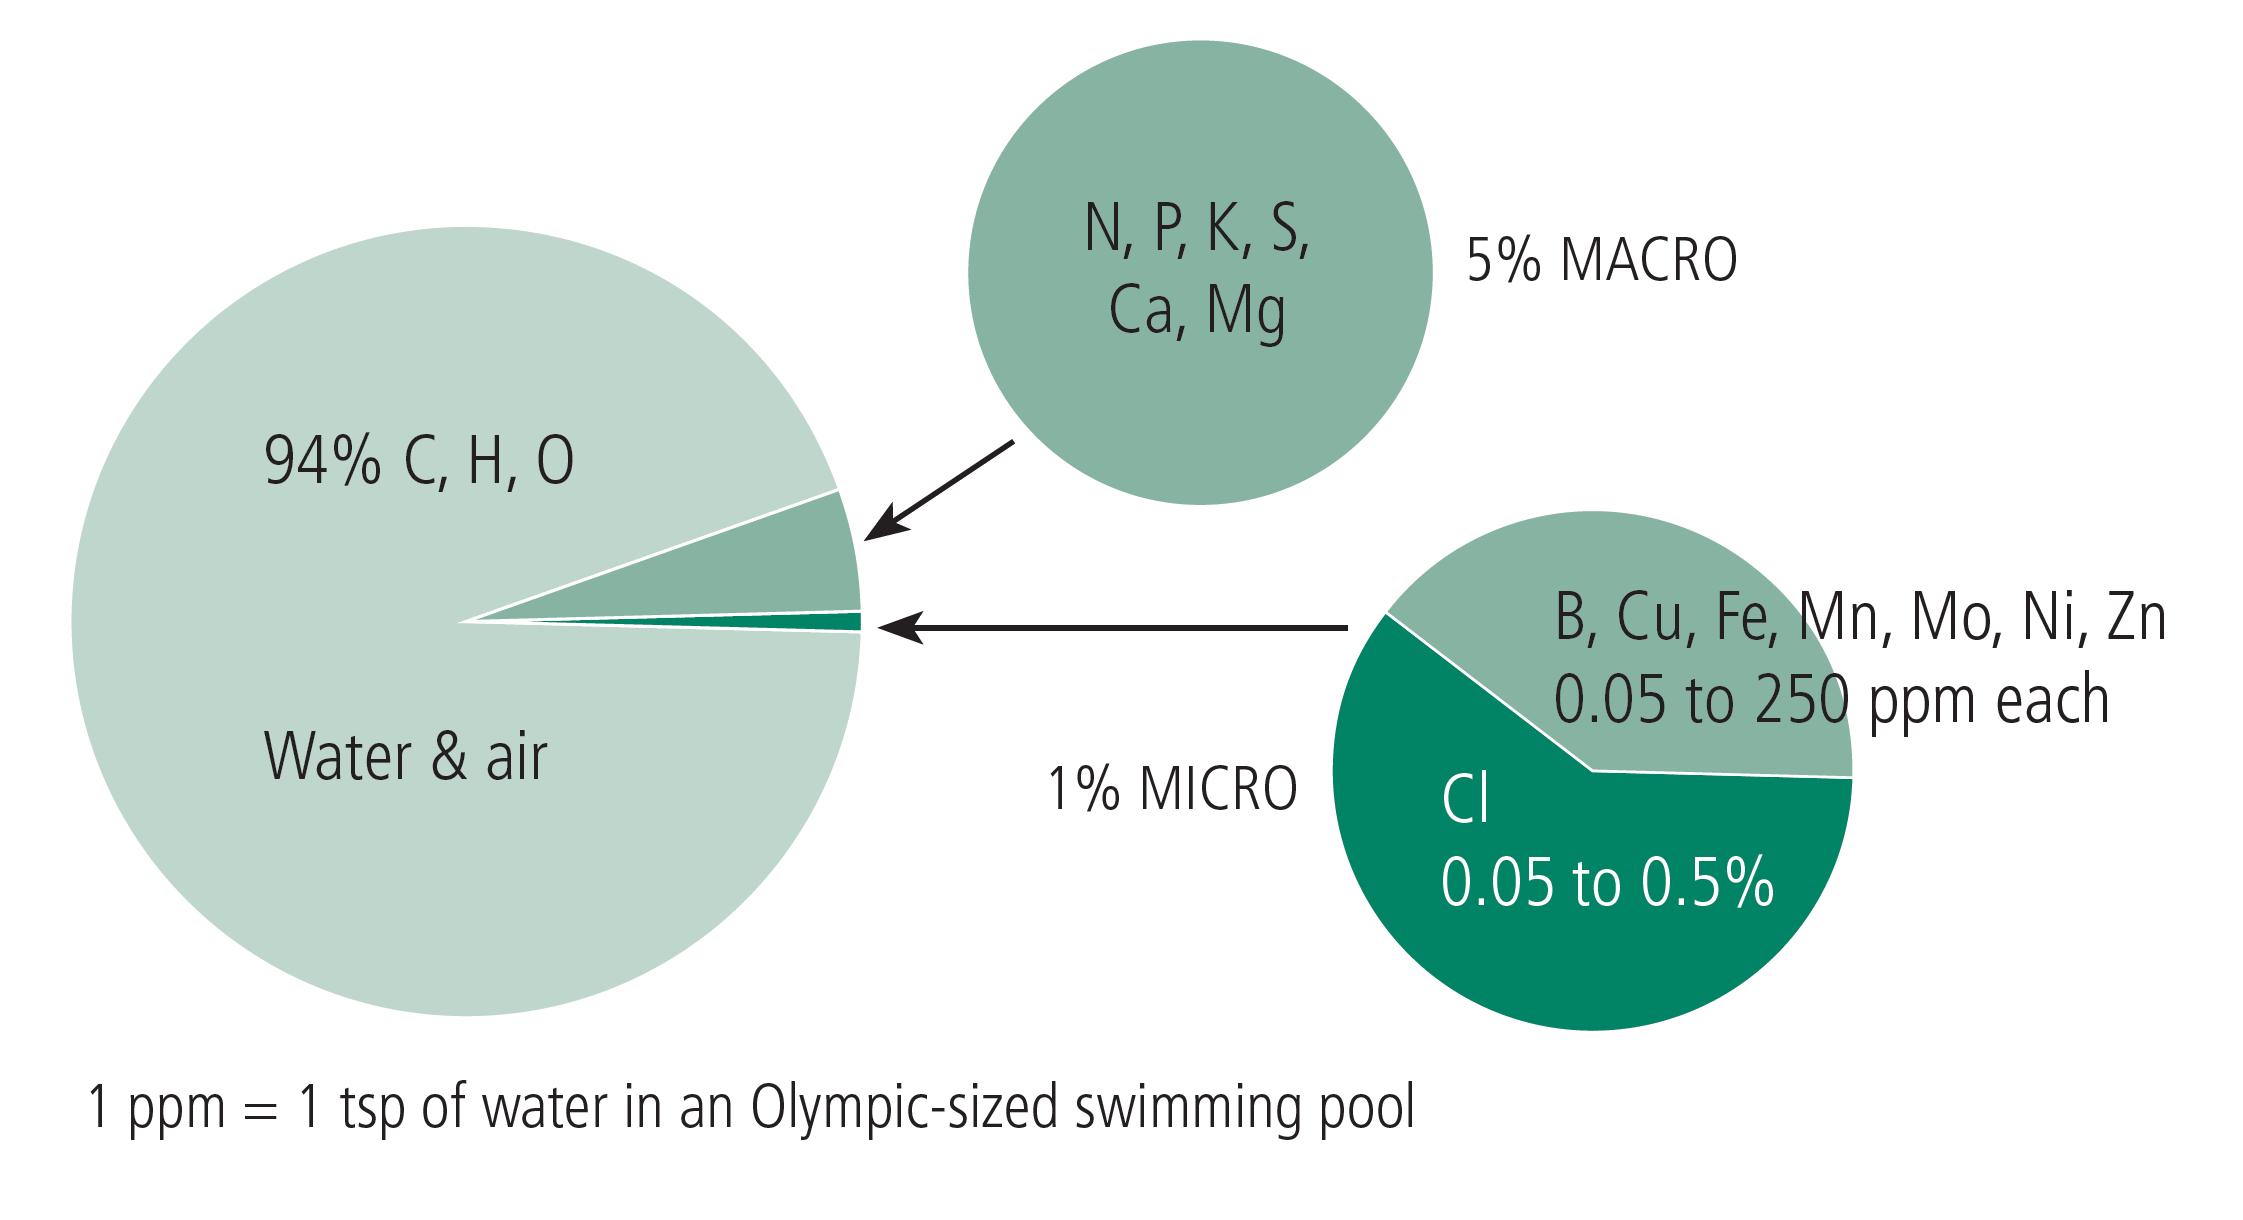
Three elements, carbon (C), hydrogen (H), and oxygen (O), are considered to be non-mineral nutrients because they are derived from air and water, rather than from soil minerals. Although they represent approximately 95% of plant biomass, they are generally given little attention in plant nutrition because they are almost always in sufficient supply (Figure 2).
FIGURE 1. The law of the minimum. Image adapted from Wikipedia.org.
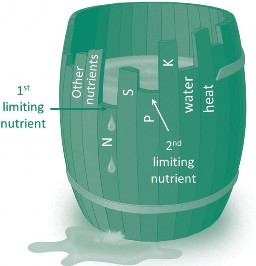
FIGURE 2. Nutrient amounts in dried plant material.
MINERAL NUTRIENTS
The 14 mineral nutrients are classified as either macronutrients or micronutrients based on their plant requirements (Q&A 1). There are six macronutrients: N, P, potassium (K), calcium (Ca), magnesium (Mg), and sulfur (S). The macronutrients, N, P, and K, are often classified as ‘primary’ macronutrients, because deficiencies of N, P, and K are more common than the ‘secondary’ macronutrients, Ca, Mg, and S. The micronutrients include boron (B), chlorine (Cl), copper (Cu), iron (Fe), manganese (Mn), molybdenum (Mo), nickel (Ni) and zinc (Zn). Most of the macronutrients represent 0.1 - 5%, or 1,000- 50,000 parts per million (ppm), of dry plant tissue, whereas the micronutrients generally comprise less than 0.025%, or 250 ppm, of dry plant tissue (Table 2, page 4). The exception is Cl, a micronutrient which has plant tissue concentrations similar to some of the macronutrients. Keep in mind that the classifications of micro vs. macronutrient refer to plant needs rather than plant uptake amounts. For example, plants can take up large amounts of Cl, yet plants need less Cl than the macronutrients, so it is classified as a micronutrient.
Q&A 1
Most producers generally apply only N, P, and K. Why is it important to learn about the other 11 mineral nutrients?
As Table 2 (page 4) shows, all of the 14 mineral nutrients are taken up by the crop and then a portion is removed from the field at harvest. If these nutrients are not replaced by either commercial fertilizers or organic materials such as manure, the amount of each in the soil will decrease, potentially limiting crop yield. In Montana and Wyoming, besides N, P, and K, there are known cases of B, Cl, Cu, Fe, Mn, S, and Zn deficiencies. By knowing the nutrients that could possibly affect yield, one can better diagnose and remedy crop nutrient deficiencies.
Nutrients cannot be taken up by plants in their elemental, or non-charged form, but instead are taken up in an ‘ionic’, or charged, form (Table 2), with the exception of boric acid which is uncharged. Most fertilizers are made up of combinations of these available nutrient forms, so when the fertilizer dissolves, the nutrients can be immediately available for uptake. Nutrients contained in plant or animal based nutrient sources (e.g., manure, plant residue) must first be converted to their ionic form through decomposition before they can be taken up by plants. Knowing what form of a nutrient the plant absorbs helps us to better understand what controls the movement of that nutrient in soil.
PLANT UPTAKE AND REDISTRIBUTION OF NUTRIENTS
Nutrient uptake by roots is dependent on both ability of the roots to absorb nutrients and nutrient concentration at the surface of the root.
ROOTS
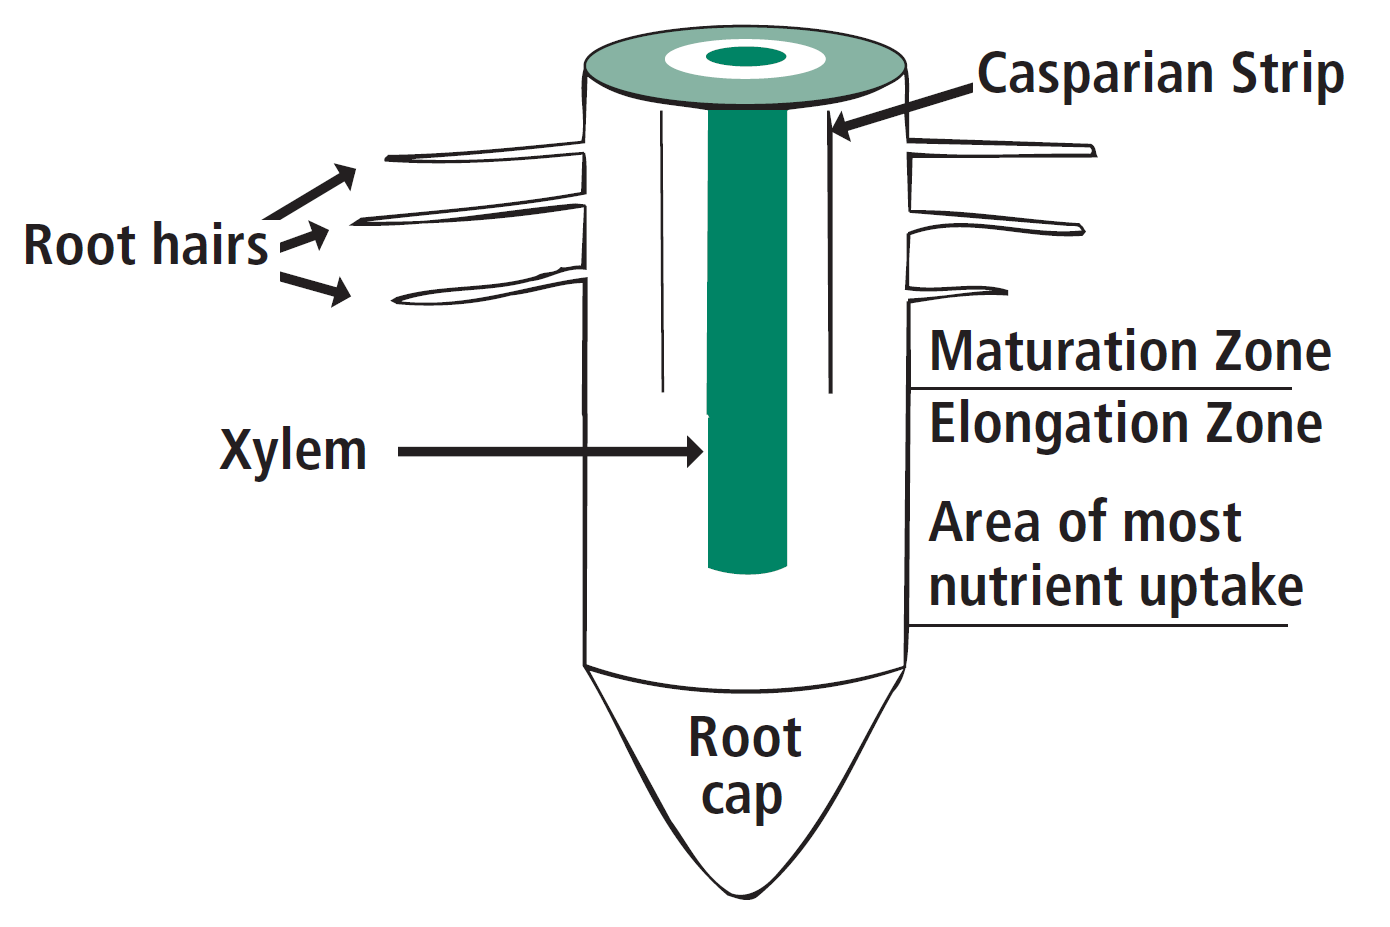
Roots are composed of both a mature zone near the shoot, and an ‘elongation zone’ near the root tip, or cap (Figure 3). Nutrients and water move freely through this elongation zone into the center of the root (the xylem), and then up into the shoot. It is more difficult for nutrients to enter the root through the more mature zone of the root due to a restriction called a ‘Casparian strip’. Therefore, nutrient levels in deep soil likely become more important later in the growing season, especially for deep-rooted plants. Roots spread out both laterally and vertically as the plant grows to take advantage of areas within the soil that have more water and nutrients. Mycorrhizal fungi are beneficial fungi that colonize the root system, which increase the surface area of soil accessed and help with nutrient and water uptake, in exchange for carbohydrates supplied by the host plant. Some crops, such as corn, are highly dependent on this association, while others do not support mycorrhizal fungi (e.g., canola).
TABLE 2. Absorbed nutrient forms and concentrations in dry plant tissue. Cations are green text, anions are white text, and acid is black text.
| Element | Form Absorbed | Concentration Range in Dry Plant Tissue |
Nitrogen (N) |
NO3 - (nitrate) | 1 - 5% |
| NH4+ (ammonium) | ||
| Phosphorus (P) | H2PO4-, HPO4-2 (phosphate) | 0.1 - 0.5% |
| Potassium (K) | K+ | 0.5 - 0.8% |
| Calcium (Ca) | Ca+2 | 0.2 - 1.0% |
| Magnesium (Mg) | Mg+2 | 0.1 - 0.4% |
| Sulfur (S) | SO4-2 (sulfate) | 0.1 - 0.4% |
Boron (B) |
H3BO3 (boric acid) | 6 - 60 ppm |
| H2BO3- (borate) | ||
| Chlorine (Cl) | Cl- (chloride) | 0.1 - 1.0% |
| Copper (Cu) | Cu+2 | 5 - 20 ppm |
| Iron (Fe) |
Fe+2 (ferrous) Fe+3 (ferric) |
50 - 250 ppm |
| Manganese (Mn) | Mn+2 | 20 - 200 ppm |
| Molybdenum (Mo) | MoO4-2 (molybdate) | 0.05 - 0.2 ppm |
| Nickel (Ni) | Ni+2 | 0.1 - 1 ppm |
| Zinc (Zn) | Zn+2 | 25 - 150 ppm |
FIGURE 3. Cross-section of lower portion of root.
NUTRIENT MOBILITY WITHIN THE PLANT
All nutrients move relatively easily from the root to the growing portion of the plant through the xylem. Interestingly, some nutrients can also move from older leaves to newer leaves if there is a deficiency of that nutrient. Knowing which nutrients are ‘mobile’ (i.e., able to move) is very useful in diagnosing plant nutrient deficiencies because if only the lower leaves are affected, then a mobile nutrient is most likely deficient. Conversely, if only the upper leaves show the deficiency, then the plant is likely deficient in an immobile nutrient, because that nutrient cannot move from older to newer leaves. Table 3 lists the six mobile and eight immobile mineral nutrients. Sulfur is one element that lies between mobile and immobile elements depending on the degree of deficiency.
TIMING OF NUTRIENT UPTAKE
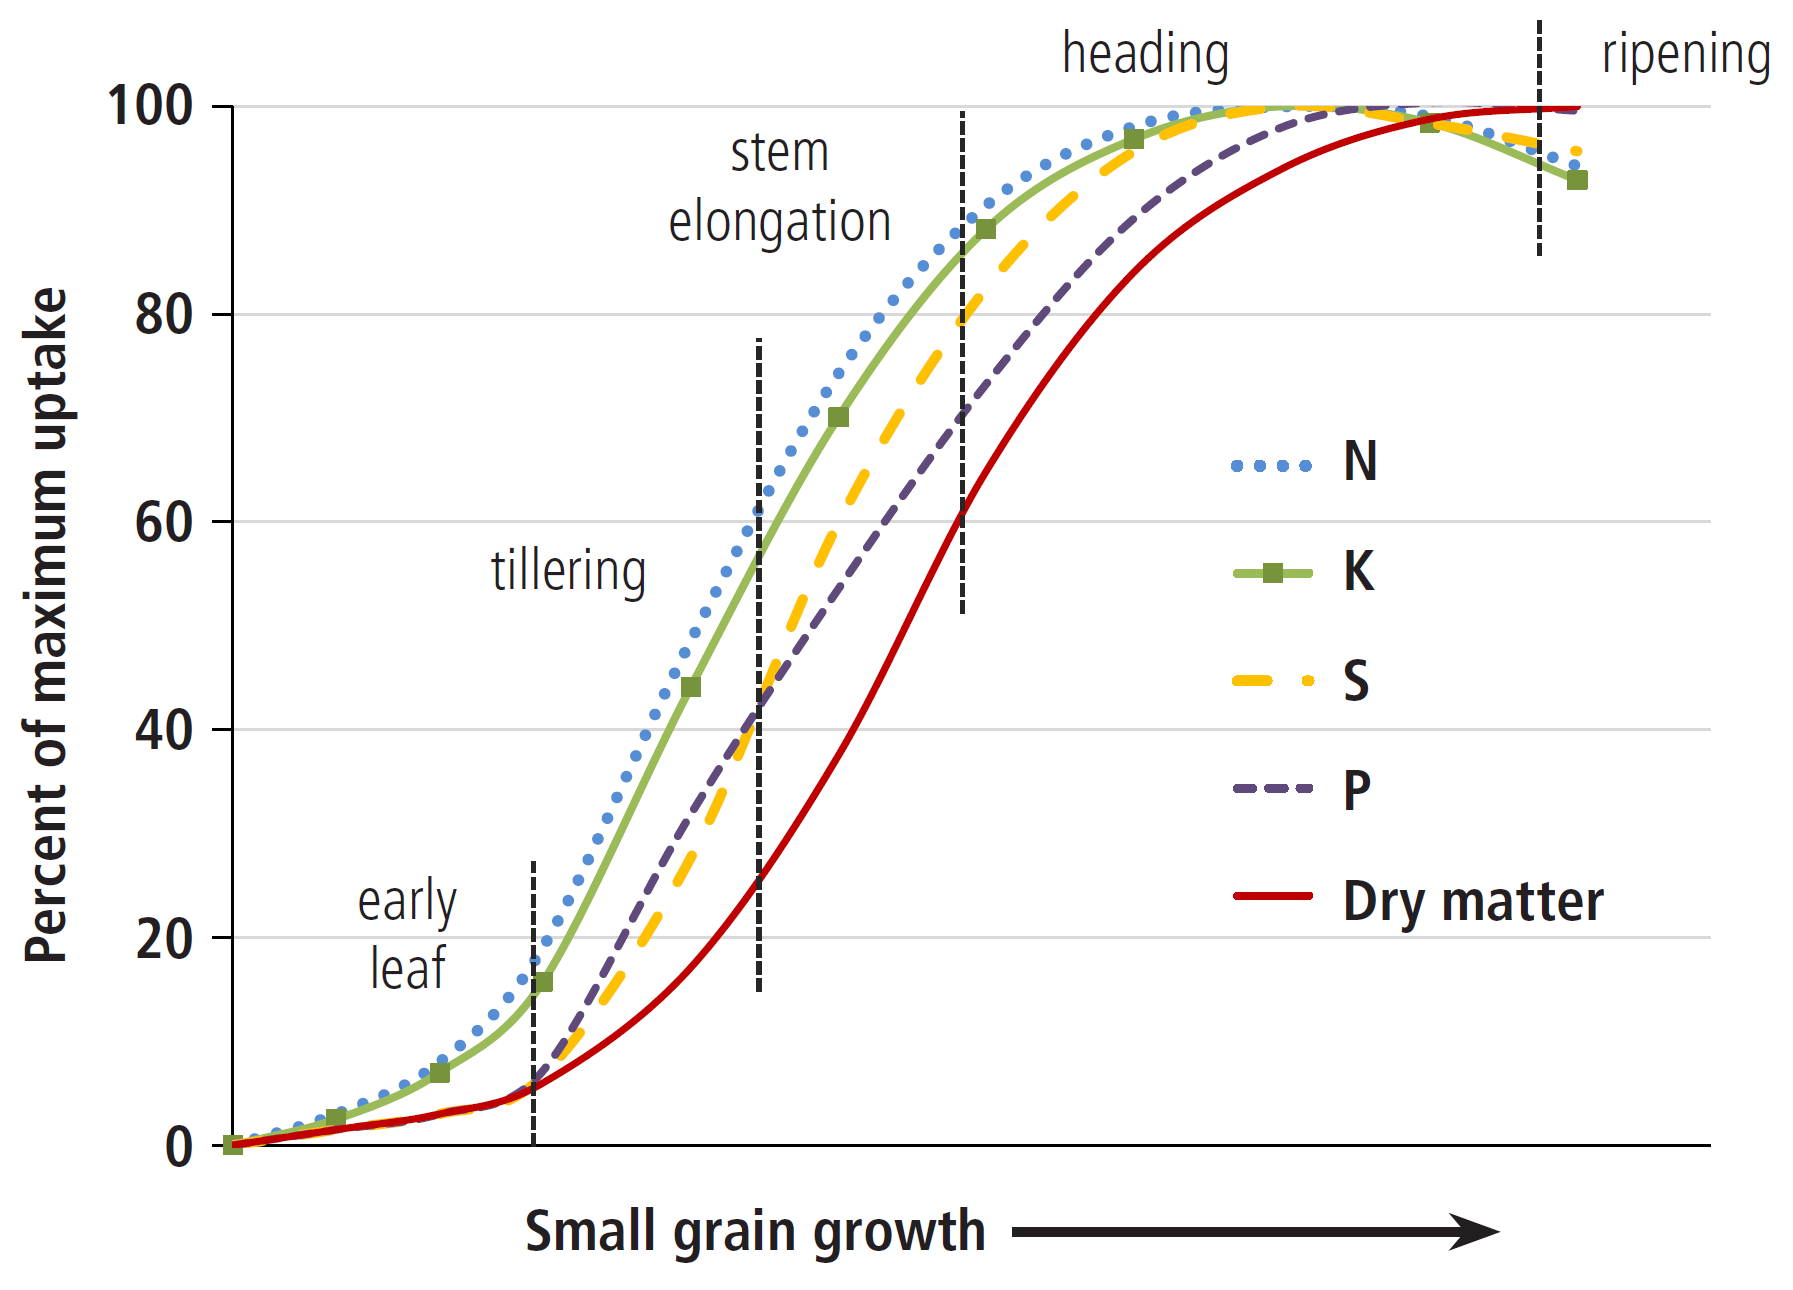
Nutrient uptake does not necessarily match an increase in plant biomass (Figure 4). For example, when small grains reach 50% of their total biomass, they have accumulated approximately 80% of their necessary N and K, 60% of P, and 70% of S. Therefore, it is important to supply sufficient nutrients early in the growing season. Seed (which includes grain) accumulates nutrients late in the growing season, either directly from nutrient stores in the leaves and stalk, through the leaves from foliar fertilizer, or through the roots. So, both seed quality and seed yield can be increased with late season nutrient application if other plant requirements are met, such as water. For example, N top-dressed at tillering can increase both yield and protein of winter wheat grown in Montana, especially at low soil N levels (2), while N applied during stem elongation to during flowering may increase grain protein (Practices to Increase Wheat Grain Protein). It is important to understand nutrient needs and timing of nutrient uptake for each crop. See ‘Nutrient Uptake’ on the MSU Extension Soil Fertility website for nutrient uptake curves of some crops.
TABLE 3. Mobile and immobile nutrients in plants.
| Mobile Nutrients | Immobile Nutrients |
| Chloride | Boron |
| Magnesium | Calcium |
| Molybdenum | Copper |
| Nitrogen | Iron |
| Phosphorus | Manganese |
| Potassium | Nickel |
| Zinc |
Sulfur (intermediate between mobile and immobile)
SOIL FERTILITY
The previous section pointed out that nutrient uptake is dependent on both the plant’s ability to absorb a nutrient and the nutrient level at the root surface. Most soils have far more nutrients than are needed by a plant in a growing season, yet often very little of these nutrients are in solution. This section describes the factors that affect nutrient concentrations in the soil solution and explains the process of how nutrients in the soil solution move toward the root.
FIGURE 4. Cumulative increase in biomass and uptake of N, P, K, and S in small grains, as percent of maximum uptake (Saskatchewan, adapted from 1).
Q&A 2
What causes clays to have negative charges?
The negative charge on layer silicate clays is due to two different processes. Much of the negative charge originates when some cations such as Mg+2 replace other cations such as Al+3 within the layer silicate structure. This substitution of a smaller charged ion for a larger charged ion during formation of the mineral leaves a net negative charge on the soil particle. The second source of the negative charge originates when a layer silicate particle breaks, exposing ‘edge sites’ that are mostly negatively charged.
Q&A 3
What is a meq?
A milliequivalent (meq) equals 6 x 10²⁰ of negative charge. Therefore, a soil with a CEC of 10 meq/100 g has 60 x 1020 negative charges on 100 g (0.22 lb) of soil. Put in more relevant terms, this means that a soil can hold about 8,000 – 10,000 lbs of cations per acre.
TEXTURE
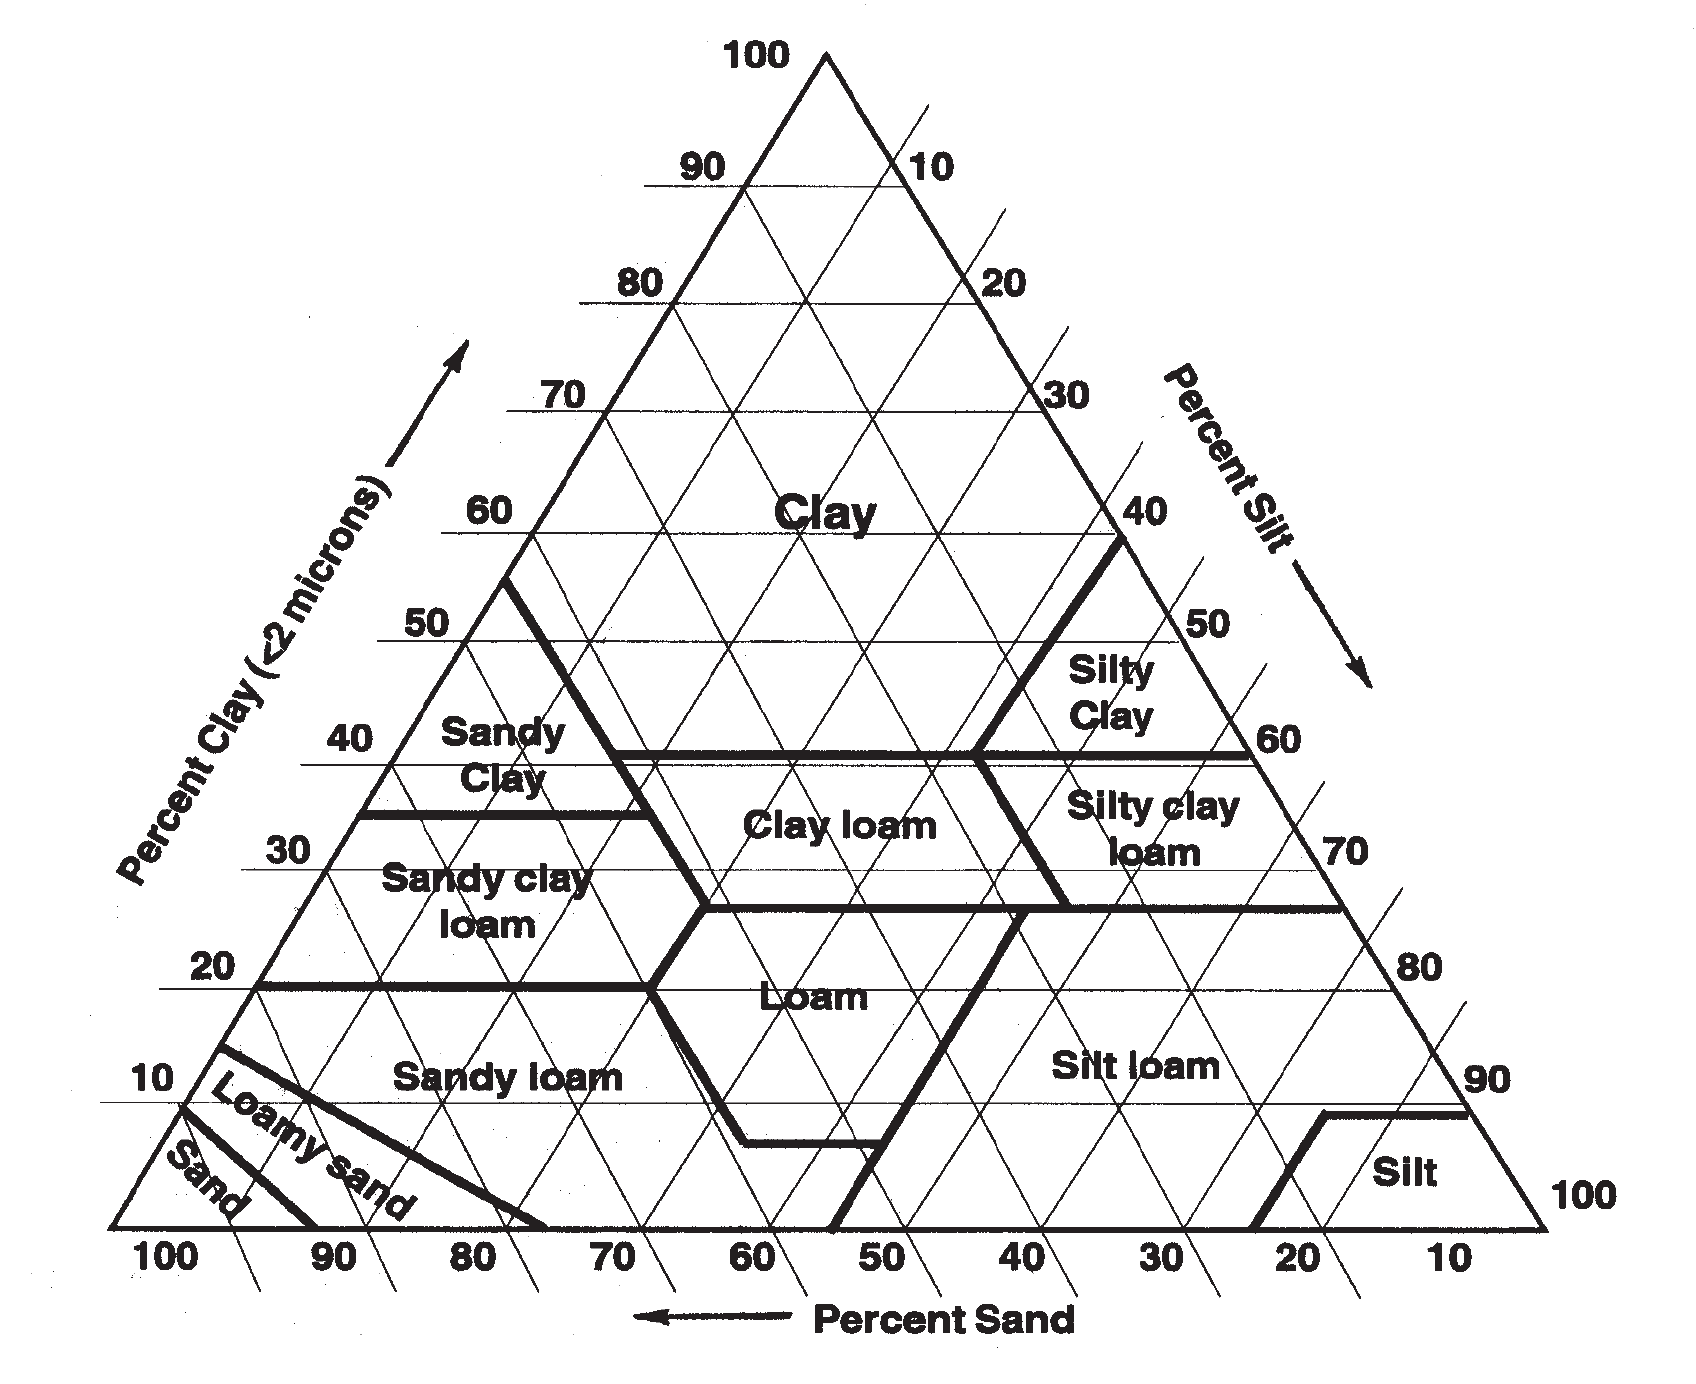
The relative amounts of sand, silt, and clay are used to define soil texture (Figure 5), which strongly influences plant nutrition due to its effect on the ability to retain both water and nutrients. Sand particles are smaller than 2 millimeters (the thickness of a nickel) and larger than 0.05 mm (half the thickness of a piece of paper). Sands have very little ability to hold water or nutrients due to large pore spaces between particles and low surface area. Conversely, clay particles are smaller than 0.002 millimeters (invisible to the naked eye) and clays can hold large quantities of water and nutrients. Soils dominated by clay have small pores that prevent water from draining freely and have very high surface areas, up to 90 acres of surface area per pound of soil. This high surface area gives nutrients numerous binding places, which is part of the reason that fine textured soils have such high abilities to retain nutrients. Another reason is that clays have net charges on their surfaces that can attract nutrients (Q&A 2).
FIGURE 5. Textural triangle showing the range in sand, silt, and clay for each soil textural class.
CATION AND ANION EXCHANGE CAPACITY
Soils hold positively charged ions (cations) such as ammonium (NH +) in the same way that hair is attracted to a balloon. Soil particles called ‘aluminosilicates’, or ‘layer silicates’, and soil organic matter all have a negative charge that attracts cations. Other soil particles, such as iron hydroxides (e.g., rust), have positive charges that attract negatively charged ions (anions), such as sulfate (SO -2). Soils generally have much higher amounts of layer silicates (negative charge) than metal hydroxides (positive charge); therefore, soils generally have a ‘net’ negative charge.
The total negative charge on soil is called the ‘cation exchange capacity’, or CEC, and is a good measure of the ability of a soil to retain and supply nutrients to a crop. Some typical values of CEC for various soil textures are shown in Table 4.
Cation exchange capacity is typically expressed in terms of milliequivalents (or meq, Q&A 3). A CEC above about 15 meq/100 g has a relatively high capacity to hold nutrient cations (e.g., K+; see Table 2). Soils that are high in clay generally have higher CEC values, although the type of clay can substantially affect CEC. Nutrients that are held by charges on a soil are termed ‘exchangeable’. Soil testing (Soil Sampling and Laboratory Selection) is often done for exchangeable nutrients, such as K, because exchangeable nutrients are the nutrients available to plants (Q&A 4).
Soils also have the ability to hold anions, (e.g., H2PO - or ‘phosphate’, see Table 2). This ability is termed the ‘anion exchange capacity’, or AEC. The AEC is generally smaller than the CEC, but is high enough in most soils to hold substantial amounts of some nutrient anions such as SO4-2.
TABLE 4. Cation Exchange Capacity (CEC) for a range of soil textures (3).
Soil Texture |
CEC Range (meq/100 g soil ) |
| Sand (light color) | 3-5 |
| Sand (dark color) | 10-20 |
| Loam | 10-15 |
| Silt loam | 15-25 |
| Clay | 20-50 |
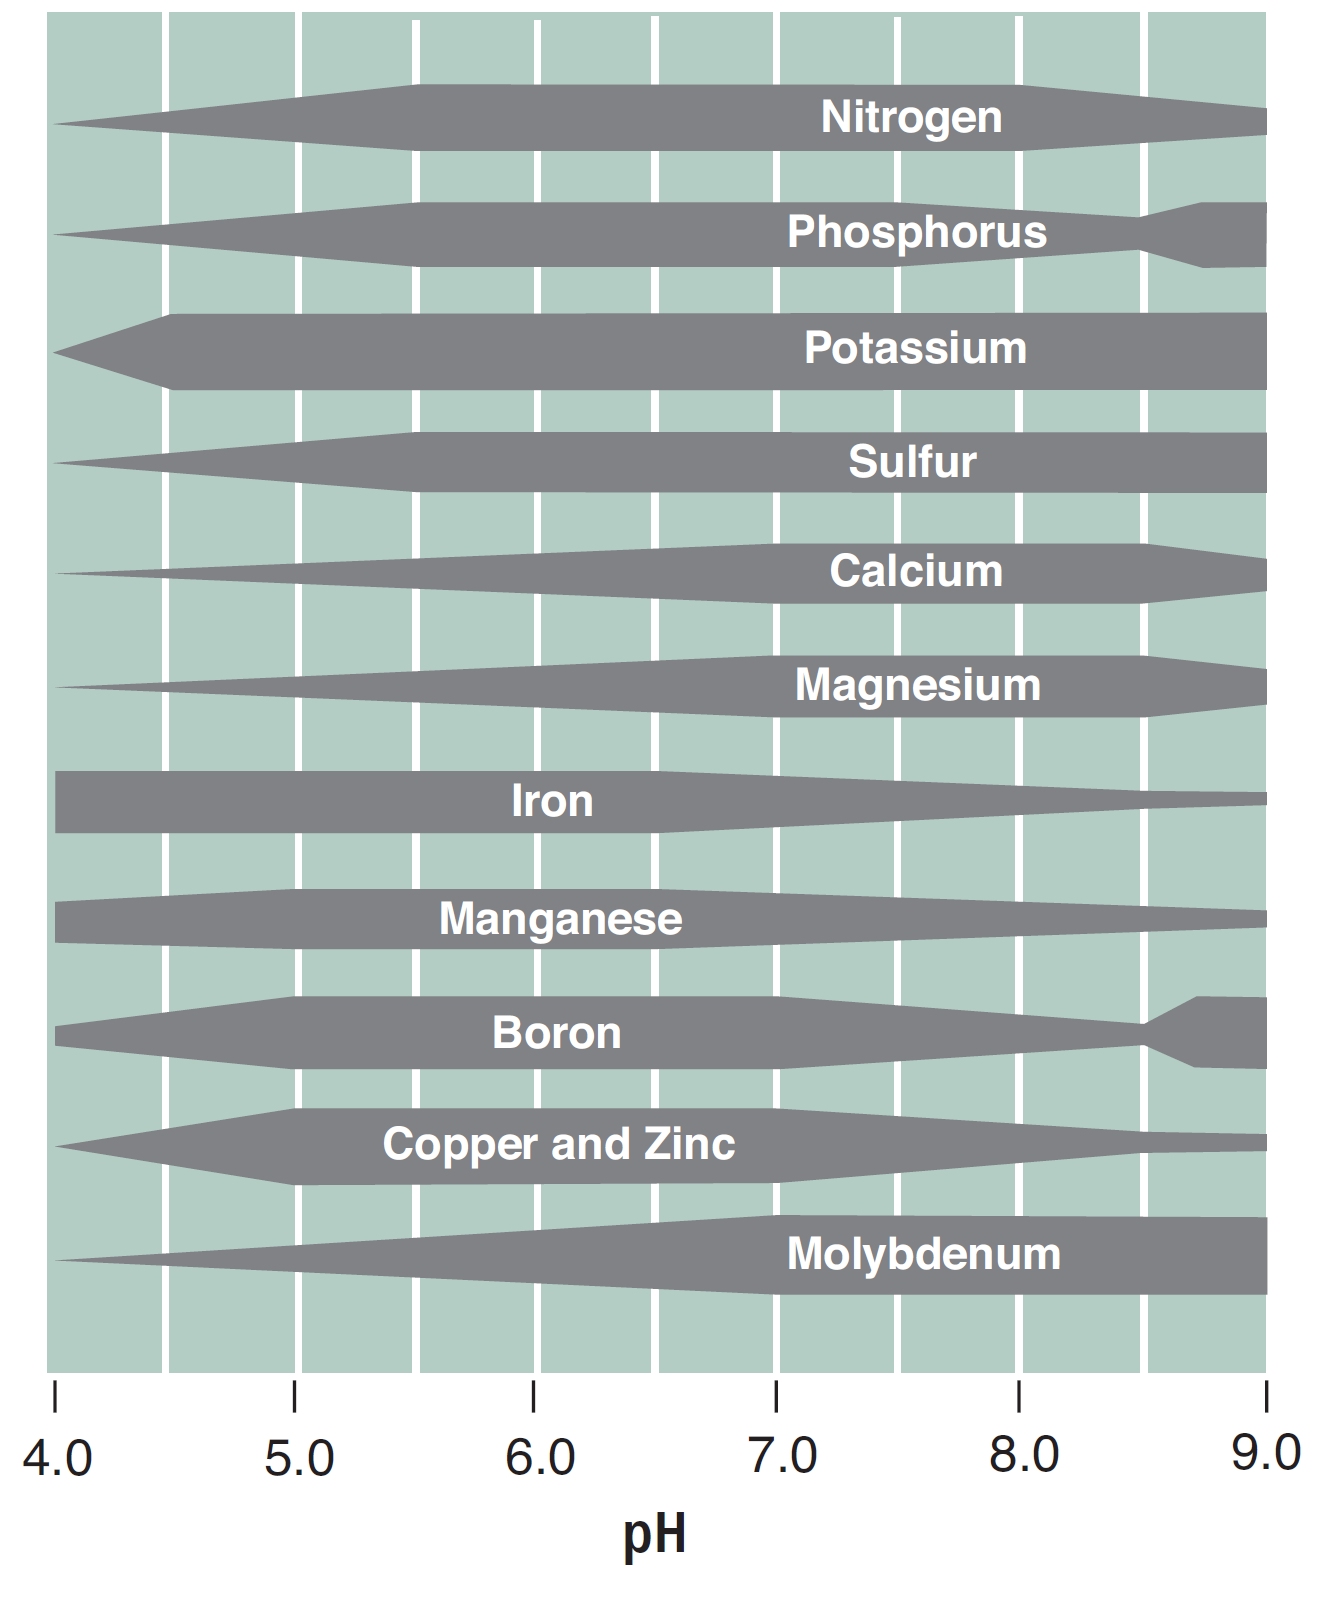
FIGURE 6. The effect of soil pH on nutrient availability. Thicker bars indicate higher nutrient availability (4).
ORGANIC MATTER
Organic matter, like clay, has a high surface area and a high CEC, making it an excellent supplier of nutrients to plants. In addition, as organic matter decomposes, it releases nutrients that are bound in the organic matter’s structure, essentially the ultimate slow release fertilizer. The CEC of organic matter can be as high as 215 meq/100 g; much higher than clay. However, the CEC of organic matter drops substantially as pH decreases (see following section). Organic matter can also hold large amounts of water, which helps nutrients move from soil to plant roots.
pH
The pH of a soil is a measure of the soil’s acidity which is based on hydrogen (H+) concentration. Soils are referred to as being alkaline (or basic; pH greater than 7), neutral (pH near 7), or acidic (pH less than 7). As pH decreases by one unit (e.g. 7 to 6), the acidity goes up by a factor of 10. Therefore, pH 6 is 10 times more acidic than pH 7, while pH 5 is 100 times more acidic than pH 7.
Soil pH affects the availability of all of the nutrients (Figure 6). For example, Cu, Fe, Mn, Ni and Zn are all more available at low pH than at high pH because metals are bound very tightly to the soil or exist in solid minerals at high pH. Conversely, the ‘base’ cations (Na+, K+, Ca+2, Mg+2) are bound more weakly to the soil, so they can leach out of the surface soil, especially at low pH, and become less available at low pH. In Montana and Wyoming, there are many soils with pH levels above 7.5; therefore, there is a higher likelihood for Fe, Mn, Ni, Cu, and Zn deficiencies than in areas with lower soil pH, although deficiencies of the micronutrients are not often observed. The optimum pH appears to be near pH 7, but every crop has different nutrient needs, and hence optimum pH levels. For example, alfalfa, pea, wheat, and barley yields decline around pH below 5.7, 5.6, 5.4, and 5.3 respectively, although there are wheat varieties that tolerate pH 5.2 (5).
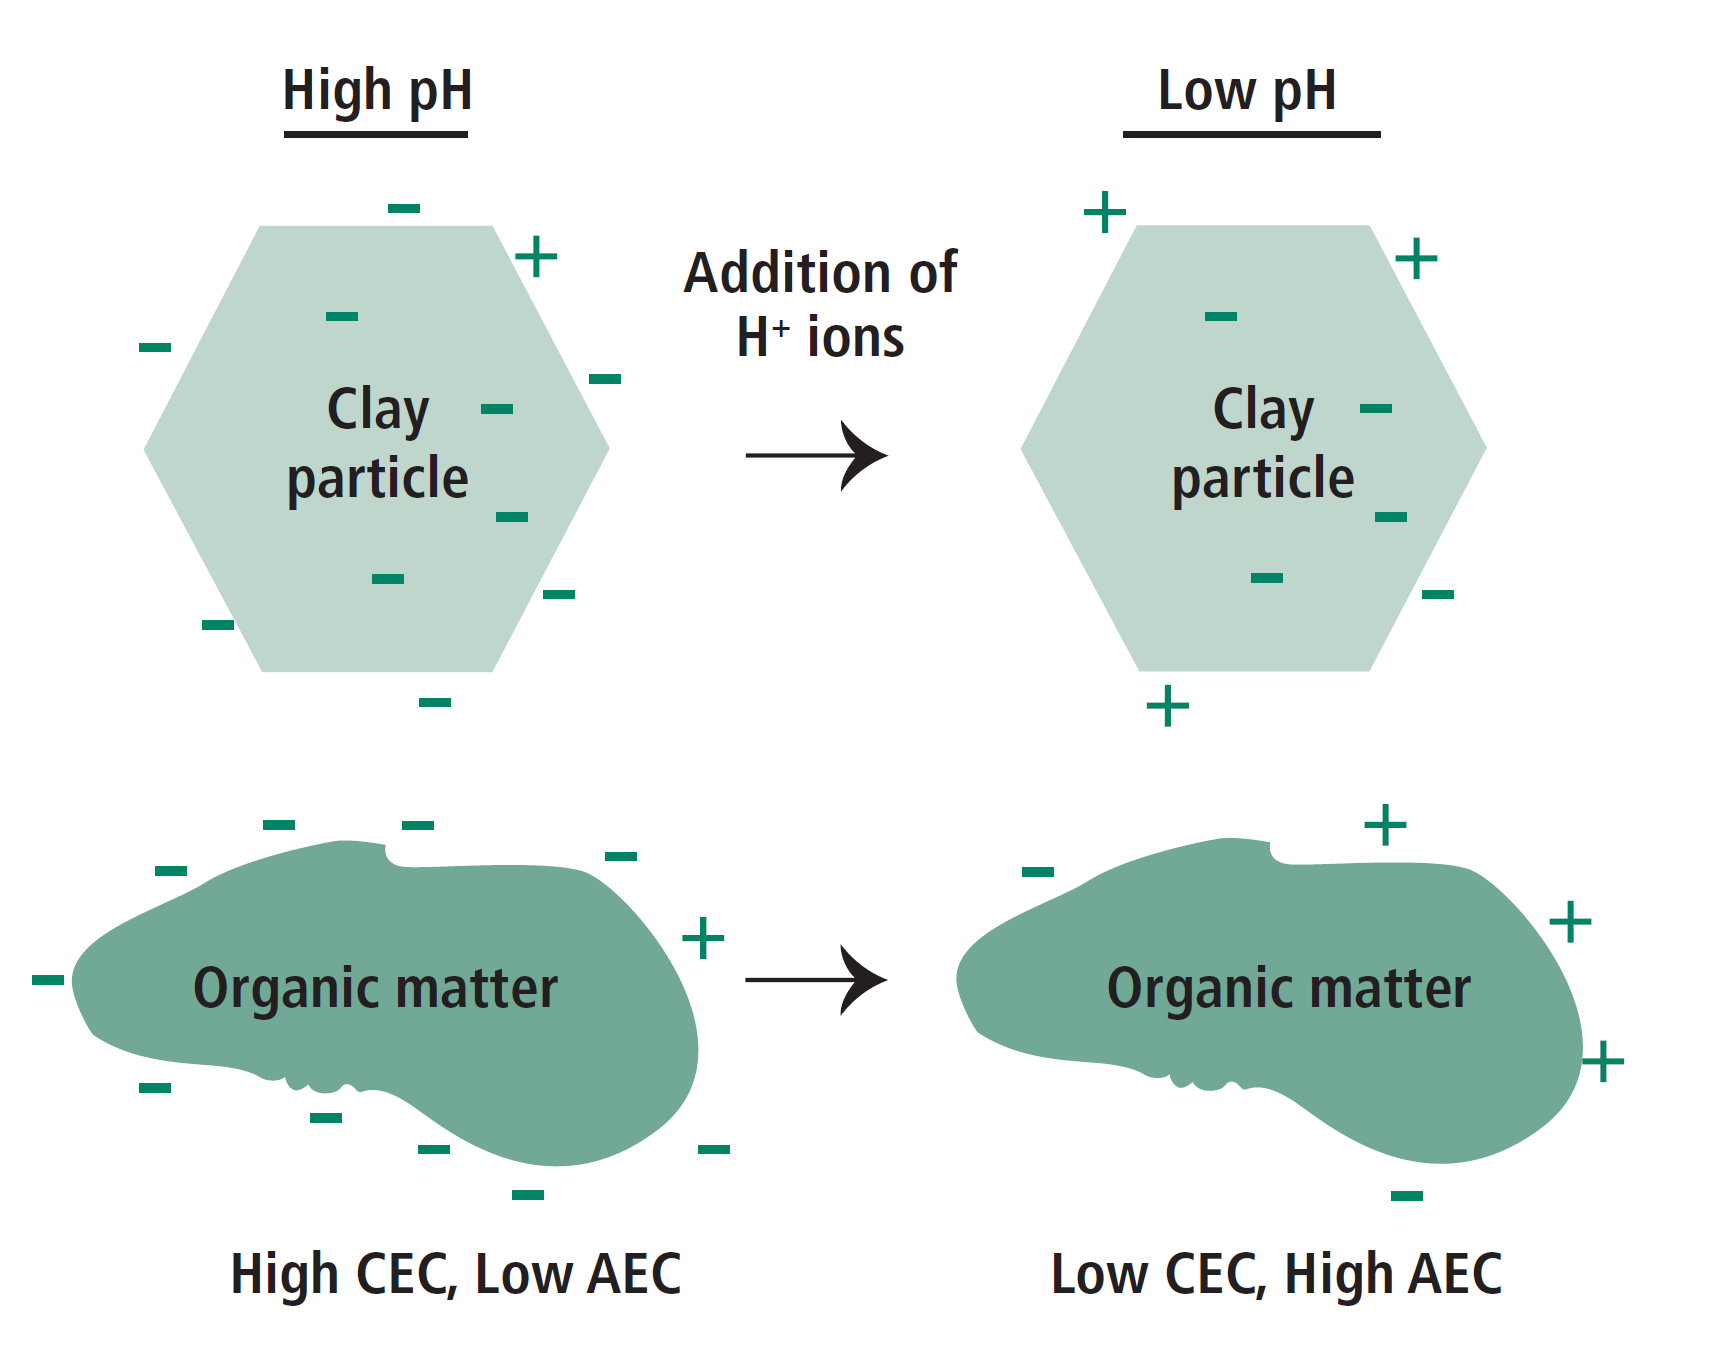
Lower pH generally causes lower CEC, because the higher concentration of H+ ions in solution will neutralize the negative charges on clays and organic matter. Figure 7 illustrates how pH affects the surface charge, and hence the CEC and AEC of both clay particles and organic matter. The effect of pH on CEC is more pronounced for soil organic matter than for layer silicates, because all of the CEC on organic matter is dependent on pH. The negative charges on the inside of the clay particle are not neutralized by H+, but they also aren’t available to bind nutrients.
Fertilizing with ammonia-based fertilizers is one way that pH decreases over time, potentially leading to lower than desirable pH in the seedling root zone. The number of Montana soil samples with pH less than 6.5 has increased 4-fold in the last 20 years (AgVise Laboratories, Inc., unpublished data). The decrease of soil pH in the rooting zone can be relatively rapid. Idaho agricultural soils went from pH around 7 to pH less than 6 in about 25 years (6). As pH drops below 5.5, soil clay releases aluminum (Al) and Mn, which can quickly reach levels toxic to plants (5). See Soil pH and Organic Matter for more information on these topics.
BASE-CATION SATURATION RATIO
Base saturation quantifies the percent of soil exchange sites occupied by the base cations (Na+, K+, Ca+2, Mg+2) versus all cations. The ‘base-cation saturation ratio’ (BCSR) is proposed as a method to make soil amendment recommendations by comparing a soil’s BCSR to an ‘ideal’ ratio of Ca:Mg:K:Na:H:other cations. The proposed ‘ideal’ ratio, varies with soil type, but is generally in the following range; 60-80% Ca, 6-20% Mg, and 2-5% K. The approach was not developed to provide N, P, S or micronutrients recommendations.
Proponents of the BCSR approach say the correct base cation ratio helps feed the soil microbial population, which in turn feeds the plant, that the Ca:Mg ratio is important for soil structure, that Ca and Mg levels are related to soil pH, which influences plant growth, and that excess of some nutrients cause deficiency of others (7). Research supports these points to an extent. However, there are concerns about using the BCSR approach. The actual nutrient concentrations can vary from deficient to in-excess in soils with the same Ca:Mg:K ratio. Soils with high CEC will hold large, sufficient amount of nutrients, while a soil with very low CEC can have the same base cation ratio, yet have deficient amounts. The base saturation level is also important. A soil can have a high base saturation level, that is, most of its exchange sites are occupied by Ca+2, Mg+2, K+ and Na+ rather than Al+3 or H+, or have very low base saturation, with relatively little Ca+2, Mg+2, K+ and Na+, yet have the same ratio among Ca, Mg, and K. The first would supply sufficient nutrients, the latter insufficient. Finally, extensive field trials that measured crop yields against variable cation ratios occurring in cropland soils with and without intentionally altered cation ratios have found no correlation between cation ratios and yield, as long as the absolute concentrations of cations were above critical sufficiency levels, and not in excess (8).
FIGURE 7. Effect of pH on CEC and AEC of clay particles and soil organic matter. Note decreased pH causes CEC to decrease and AEC to increase (more positive charges).
Managing soils to maintain or improve microbial health, adding Ca or minimizing Mg to affect soil structure, adjusting pH if needed and feasible, and avoiding nutrient imbalances are all worthy goals. However, the base-cation saturation ratio concept is not an ideal approach to soil nutrient management (9). Interpretation of Soil Test Reports for Agriculture and Developing Fertilizer Recommendations for Agriculture present recommended soil testing methods and how to calculate fertilizer rates.
Q&A 4
How does CEC affect nutrient availability?
Soils with high CECs hold more positively charged nutrients such as Ca+2. One might think that if the soil is holding, or binding the nutrients, that they are not available to plants. However, these attractions are weak, allowing an exchange between nutrients in the soil water and nutrients on the surface of the soil particle, so as nutrients are taken up by a plant, more leave the soil surface and enter soil water. Generally, there are many more nutrients attached to the soil than are in soil water. A count of exchangeable nutrients is a much better measure of available nutrients than solely nutrient concentrations in soil water.
NUTRIENT MOBILITY IN SOIL
An earlier section discussed the mobility of each nutrient within the plant. Nutrient mobility is somewhat different in soil than in plants, and explains why some nutrients are less available for plant growth than others. Nutrient mobility affects how we fertilize. For example, N fertilizer can be broadcast or incorporated with fairly similar results because it is quite mobile. However, P fertilizer is generally either banded or applied with the seed because it is quite immobile in most soils. Table 5 illustrates the relative mobility in soil of each of the 14 essential mineral nutrients.
As a good general rule, NH+, K+, Ca+2, and Mg+2 are more mobile than the metals (Cu+2, Fe+2, Fe+3, Mn+2, Ni+2, Zn+2). Fertilizing with any of the mobile elements generally needs to be done more frequently than the immobile elements because the mobile elements are more readily taken up or leached than the immobile elements. The immobile nutrients can be ‘banked’, meaning more can be applied than meet crop needs as a way of storing them for future cropping cycles. ‘Soil banking’ is also referred to as a ‘build’ program (see Soil Sampling and Laboratory Selection).
NUTRIENT MOVEMENT TO PLANT ROOTS
Roots come directly in contact with some nutrients (called ‘root interception’) as they grow; however, this only accounts for approximately 1-2.5% of the total N, P, and K uptake of a plant (10). Some plant species form associations with mycorrhizal fungi. This especially benefits plant uptake of immobile nutrients at low soil nutrient levels. Other mechanisms contribute to the movement of nutrients to the plant.
Water moves toward and into the root as the plant uses water, or transpires. This process, called ‘mass flow’ (or ‘advection’), accounts for a substantial amount of nutrient movement toward the plant root, especially for the mobile nutrients such as NO -. Specifically, mass flow has been found to account for about 80% of N movement into the root system of a plant, yet only 5% of the more immobile P (10). ‘Diffusion’ accounts for the remainder of the nutrient movement (Q&A 5).
Diffusion is the process where chemicals move from an area of high concentration to an area of low concentration. For example, if you open a bottle of ammonia in a closed room, you can soon smell it at the other side of the room because it has diffused from the mouth of the bottle that had high ammonia concentrations, to the areas of the room that previously had no ammonia. This same process occurs in soil water, although it generally occurs much slower. The nutrients that are most dependent on diffusion to move them toward a plant root are relatively immobile (Table 5), have relatively low solution concentrations, and yet are needed in large amounts by the plant, such as P and K. By fertilizing with immobile nutrients near the plant root, the plant is less dependent on diffusion. The secondary macronutrients (Ca, Mg, S) often do not depend on diffusion because their solution concentrations are fairly high in soil relative to plant requirements.
TABLE 5. Mobility of nutrients in soil.
| Mobile | Relatively Immobile |
| Boron | Calcium |
| Chloride | Copper |
| Nitrogen | Iron |
| Sulfur | Magnesium |
| Manganese | |
| Molybdenum | |
| Nickel | |
| Phosphorus | |
| Potassium | |
| Zinc |
Q&A 5
How do the relatively immobile nutrients ever make it to the plant roots?
The plants create a zone directly next to the root that has very low concentrations of these immobile nutrients. This allows diffusion to occur which pulls nutrients that are further away from the root towards the root. This, in turn, pulls more of these immobile nutrients off the soil surface to maintain a balance between nutrients in solution and nutrients on the surface of the soil.
SUMMARY
Plants need 17 elements, called nutrients, to grow and complete their life cycle. Three of these nutrients come from air or water, whereas the other 14 are derived from thesoil. Each of the nutrients performs a specific function or functions within the plant, and the amount of each needed by the plant depends largely on function. A limitation of one nutrient can prevent the uptake of others, and ultimately, impact crop yield and quality. Plant uptake of nutrients is dependent on both the ability of the root system to absorb nutrients and the nutrient concentration in soil solution. Nutrient accumulation within the plant is generally faster than biomass accumulation, which is one reason that fertilizing early in the growing season is important.
Soils have large quantities of most nutrients, yet the majority of these nutrients are not in the soil solution, but instead are bound to the soil. Some of these nutrients are available to plants because they are only weakly bound as exchangeable nutrients. The cation exchange capacity (CEC) is one measure of the total amount of exchangeable cations that canbe held by the soil, and generally is a good general indicator of soil fertility. Cation exchange capacity is higher in soils with high amounts of clay and organic matter, and is lower in acid soils. Soil pH strongly affects the plant availability of each of the nutrients, with pH levels near 7 generally having optimum availability.
Nutrients vary greatly in their relative mobility within a soil. For example, nitrate (NO3-) is highly mobile, yet phosphate (HPO4-2 , H2PO4-) is relatively immobile. These differences are key to developing effective nutrient management programs, and explain why applying immobile nutrients such as P near the root system is important for optimum nutrient uptake. Other Nutrient Management Modules address each specific nutrient in more detail, with emphasis on factors affecting mobility, uptake, and fertilizer requirements.
REFERENCES
- Malhi, S.S., A.M. Johnston, J.J. Schoenau,Z.H. Wang, and C.L. Vera. 2006. Seasonal biomass accumulation and nutrient uptake of wheat, barley and oat on a Black Chernozem soilin Saskatchewan. Canadian Journal of Plant Science. 86:1005–1014. doi:10.4141/P05-116
- Lorbeer, S.L., J. Jacobsen, P. Bruckner, D. Wichman, and J. Berg. 2000. Capturing the Genetic Protein Potential in Winter Wheat. Fertilizer Facts No. 23. Montana StateUniversity Extension. http://landresources.montana.edu/fertilizerfacts/index.html
- Havlin, J.L., J.D. Beaton, S.L. Tisdale, and W.L. Nelson. 2005. Soil Fertility and Fertilizers: An Introduction to Nutrient Management. 8th edition. Prentice Hall. Upper Saddle River, New Jersey. 515 p.
- Hoeft R.G., E.D. Nafziger, R.R. Johnson, and S.R. Aldrich. 2000. Modern Corn and Soybean Production. MCSP Publications. Champaign, Illinois. 353 p.
- McFarland, C., D.R. Huggins, and R.T. Koenig. 2015. Soil pH and Implications for Management: An Introduction. Washington State University Extension FS170E. 7 p.
- Mahler, R.L., A.R. Halvorson, and F.E.Koehler. 1985. Long term acidification of farmland in northern Idaho and Eastern Washington. Communications in SoilScience and Plant Analysis. 16:1, 83-95. doi:10.1080/00103628509367589
- Kinsey, N., and C. Walters. 1995. Hands-on Agronomy. Acres U.S.A.. Metairie, Louisiana. 352 p.
- Kopittke, P.M., and N.W. Menzies. 2007. A Review of the Use of the Basic Cation Saturation Ratio and the “Ideal” Soil. Soil ScienceSociety of America Journal. 71:259-265. doi:10.2136/sssaj2006.0186
- McKenzie, R. 2015. Using Base-Cation Saturation Ratios. Grainews. December 1, 2015. www.grainews.ca/2015/12/01/ using-base-cation-saturation-ratios/
- Foth, H.D., and B.G. Ellis. 1996. Soil Fertility. 2nd Ed. CRC Press. Boca Raton, Florida. 290 p.
APPENDIX
EXTENSION MATERIALS
Developing Fertilizer Recommendations for Agriculture (MT200703AG)
Fertilizer Guidelines for Montana Crops (EB0161)
Interpretation of Soil Test Reports for Agriculture (MT200702AG)
Practices to Increase Wheat Grain Protein (EB0206)
Soil Sampling and Laboratory Selection Nutrient Management Module No. 1. (4449-1)
Soil pH and Organic Matter Nutrient Management Module No. 8 (4449-8)
Available online at http://landresources.montana.edu/soilfertility/, under ‘Extension Publications’, or obtain the MSU Extension materials from:
MEDIA
4R Plant Nutrition. 2012 International Pla

