

Commercial Fertilizers and Soil Amendments
This module is the tenth in a series of Extension materials designed to provide Extension agents, Certified Crop Advisers (CCAs), consultants, and producers with pertinent information on nutrient management issues. To make the learning ‘active’, and to provide credits to CCAs, a quiz accompanies this module. In addition, realizing that there are many other good information sources, including previously developed extension materials, books, web sites, and professionals in the field, we have provided a list of additional resources and contacts for those wanting more in-depth information about fertilizers and amendments. This module covers the Rocky Mountain CCA Nutrient Management Competency Area VI: Nutrient sources and applications.
Last Updated: 05/09by Ann McCauley, Soil Scientist; Clain Jones, Extension Soil Fertility Specialist; and Jeff Jacobsen College of Agriculture Dean
Objectives
After completing this module, the reader should:
- Understand fertilizer grade and calculate elemental nutrient content of a fertilizer
- Recognize fertilizer manufacturing processes and forms
- Know the effects of various fertilizers on soil pH and salt concentrations
- Understand fertilizer reactions in the soil
- Determine the appropriate soil amendment for a given soil condition
- Recognize the potential for heavy metal accumulation following fertilizer or amendment application and calculate maximum allowable metal levels for products
Background
Commercial fertilizer and amendment use increased substantially worldwide during the latter half of the 20th century and continues to increase into the 21st century. As a result, numerous products have emerged, offering a variety of nutrient contents, physical forms, and other properties to meet individualneeds. A number of these materials and their applications have been described in Nutrient Management Modules 2-7.
In choosing a fertilizer or amendment product, a buyer should appraise the following:
- content (nutrients and other components);
- cost per unit of available nutrient or amendment;
- ease of handling and application costs;
- reaction effects in the soil; and
- personal preference.
The purpose of this module is to explain terminology, physical and chemical properties, and soil reactions associated with common commercial fertilizers and amendments. The mention (or non-mention) of any products in this publication does not indicate endorsement or lack of endorsement of any particular product.
Figure 1. Sample fertilizer label.
15-30-15
GUARANTEED ANALYSIS
- Total Nitrogen (N) 15.0%
- 5.8% Ammoniacal Nitrogen
- 9.2% Urea Nitrogen
- Available Phosphoric Acid (P2O5) 30.0%
- Soluble Potash (K2O) 15.0%
- Boron (B) 0.02%
- Copper (Cu) 0.07%
- 0.07 Water Soluble Copper (Cu)
- Iron (Fe) 0.15%
- 0.15% Chelated Iron
- Manganese (Mn) 0.5%
- 0.05% Chelated Manganese
- Molybdenum (Mo) 0.0005%
- Zinc (Zn) 0.06%
- 0.06 Water Soluble Zinc
Derived from Urea, Ammonium Phosphate, Urea Phosphate, Muriate of Potash, Boric Acid, Copper Sulfate, Iron EDTA, Manganese EDTA, Sodium Molybdate, and Zinc Sulfate.
Q&A #1
Why are P and K labeled in their oxide forms?
P2O5 and K2O are remnants from the days when geochemists reported the contents of minerals in terms of the oxides formed upon heating. When laws governing the sale of fertilizers required the labeling of fertilizer grade, these oxide forms made it onto the label. While most fertilizer producers still report P and K in their oxide forms, there is some progress being made toward stating the simple elemental forms (adapted from Brady and Weil, 1999).
Fertilizer Materials
Content
The amount of nutrient present in a fertilizer material is the fertilizer grade, or guaranteed analysis. By law, fertilizer manufacturers are required to state the grade on each product label. Fertilizer grade is generally labeled as a three- number code (Figure 1) of the three primary macronutrients: nitrogen (N), phosphorus (P), and potassium (K). The first value corresponds to total nitrogen content, the second to available phosphorus (P2O5), and the third to water soluble potash (K2O) content. Each value represents a percentage of nutrient content by weight. For example, in Figure 1, 15% of the fertilizer is N, 30% is P2O5 , and 15% is K2O. Thus, a 50 pound bag of 15-30-15 contains 7.5 pounds of N, 15 pounds of P2O5, and 7.5 pounds of K2O.
Total N content is represented as elemental N and may be further broken down into four N forms: nitrate nitrogen, ammoniacal nitrogen, water soluble organic nitrogen (and/or urea), and water insoluble nitrogen. Knowing which N form is present in a fertilizer is important in determining the availability of N in the soil (see Nutrient Management Module 3).
P and K are labeled as their oxide forms, P2O5 and K2O, respectively, rather than their elemental forms (Q & A #1). Therefore, conversion factors are required to calculate elemental P and K concentrations in a given fertilizer (Table 1, Calculation Box #1) and are derived from the proportion of P in P2O5 and K in K2O.
Table 1. Conversion between %P2O5, %K2O and %P, %K
| Column A | Column B | Multiply by A to get B | Multiply by B to get A |
| % P2O5 | % P | 0.44 | 2.3 |
| % K2O | % K | 0.83 | 1.2 |
In addition to primary macronutrients, fertilizers may contain other nutrients, such as sulfur (S), iron (Fe), boron (B), zinc (Zn), and molybdenum (Mo). These nutrients may be added as additional nutrients or may be,constituents (impurities) remaining in the fertilizer material following mining and manufacturing processes (discussed later). If present as additional nutrients (as in Figure 1), nutrients will be listed on the fertilizer label on an elemental basis, similar to N. Forms and solubilities may also be listed. If a significant source of a particular nutrient, other than N, P, or K, is present in the fertilizer, it is typically labeled as a fourth value in the fertilizer grade. This is most often seen with fertilizers containing S (e.g., 21-0-0-24(S)).
Table 2, next page, lists typical compositions for common fertilizers. Note that some of the fertilizer sources have a range of nutrient contents; for instance, monoammonium phosphate (MAP) can contain between 48% and 62% P2O5. This range is the result of fertilizers containing other constituents (impurities), moisture, or filler materials (inert compounds) that cause nutrient content by weight to change. So, although many fertilizers are often referred to by their typical grade (i.e., all MAP fertilizers are often called 11-52-0), a particular fertilizer product may in fact have a different grade depending on the fertilizer source and manufacturing process.
Based on their primary nutrient content (N, P2O5, K2O), fertilizers are referred to as being single-nutrient or multiple-nutrient. Single-nutrient fertilizers, such as urea (46-0-0), contain only one primary macronutrient and are also called ‘simple’ or ‘straight’ fertilizers. In contrast, multiple nutrient fertilizers contain more than one nutrient, such as diammonium phosphate (DAP, 18-46-0), and may be referred to as ‘mixed’ or ‘complex’ fertilizers. A fertilizer or blend containing all three primary nutrients (e.g., 15-30-15) is a ‘complete’ fertilizer.
Calculation Box #1
Calculation:Amount of available P in a fertilizer = % P2O5 x 0.44Amount of soluble K in a fertilizer = % K2O x 0.83Example: How much N, P, and K are in a 25 pound (lb) bag of 16-6-12?
Recall that the numbers given in the fertilizer grade are a percentage of that nutrient in the fertilizer by weight and can be expressed as a fraction (i.e., 6% = 0.06).
Since a conversion factor is not required for N, N content = 0.16 x 25 lb = 4 lb of NThe conversion factor for P2O5 is 0.44, so P content = 0.06 x 0.44 x 25 lb = 0.66 lb of PThe conversion factor for K2O is 0.83, so K content = 0.12 x 0.83 x 25 lb = 2.5 lb of K
Fertilizers with relatively large amounts of nutrient(s) per unit weight are ‘high analysis’ fertilizers. For instance, urea (46-0-0) supplies more N per pound of fertilizer than ammonium nitrate (34-0-0). Thus, urea has a higher analysis for N than ammonium nitrate. Generally, high analysis fertilizers are more expensive per ton than low analysis fertilizers, but may provide nutrients at a lower cost per unit of available nutrient than low analysis fertilizers. This is due to less ‘other’ material in high analysis fertilizers, resulting in reduced transportation, storage, and application costs.
Additional Fertilizer Information
Fertilizer labels, material safety data sheets (MSDS), and product specification sheets also supply additional information regarding physical and chemical characteristics of the product. MSDS and product specification sheets are available from the fertilizer manufacturer and/or distributor.
Table 2. Typical nutrient compositions of common fertilizers (Modified from Havlin et al., 1999).
| Fertilizer Source | Frequently Used Abbreviations |
Molecular Form |
% N | % P2O5 | % K2O | % S | Physical State |
| Anhydrous Ammonia |
AA | NH3 | 82.0 | - | - | - | Gas |
| Ammonium nitrate |
AN | NH4(NO3) | 34 | - | - | - | Solid (pellets) |
| Urea-ammonium nitrate |
UAN | 28-32 | - | - | - | Liquid | |
| Monoammonium phosphate |
MAP | NH4H2PO4 | 11-13 | 48-62 | 1-3 | Solid | |
| Diammonium phosphate |
DAP | (NH4)2HPO4 | 18-21 | 46-54 | - | 2 | Solid (granules) |
| Ammonium phosphate-sulfate |
- | NH4H2PO4• (NH4)2SO4 |
13-16 | 20-39 | - | 15 | Solid |
| Ammonium sulfate |
- | (NH4)2SO4 | 21 | - | - | 24 | Solid (granules) |
| Potassium chloride |
- | KCl | - | - | 60 | - | Solid |
| Potassium sulfate |
- | K2SO4 | - | - | 52 | 18 | Solid |
| Urea | CO(NH2)2 | 46 | - | - | - | Solid (pellets) | |
| Triple super-phosphate | TSP or CSP | Ca(H2PO4)2 | - | 44-53 | - | 1-1.5 | Solid |
Solid fertilizer physical characteristics include color, particle size, and bulk density. Particle size is determined as the size and amount of product retained on a given ‘mesh size’ screen. Mesh size refers to the number of screen wires per inch; increasing mesh size corresponds to smaller screen openings. Depending on fertilizer type and manufacturer, there may be a range of particle sizes for a given fertilizer. Bulk density refers to the mass of dry fertilizer per unit of bulk volume, usually in pounds per cubic foot. Bulk density may be labeled as loose or packed particles (or both). Particle size and bulk density information are important properties for determining fertilizer reaction time in the soil and for blending and application purposes (discussed later).
Typical chemical fertilizer properties listed include molecular weight, pH, and moisture content. Molecular weight is the atomic weight of all elements in the fertilizer molecule or ‘carrier.’ A fertilizer carrier is the molecular form containing the plant nutrient. For example, potassium chloride (KCl) is a carrier of K and its molecular weight is the atomic weight of K (39) plus the atomic weight of Cl (35.5), or 74.5 (atomic weights are from the periodic table of elements). Molecular weights can be used to calculate percent weight content of all components in a fertilizer.
Fertilizer pH is measured as the pH of the material in a water solution and is an indication of a fertilizer’s initial reaction in the soil upon being applied. Moisture content is typically less than 1% for most solid fertilizers.
Origin and Manufacture of Fertilizers
Nitrogen
From the viewpoint of commercial agriculture, industrial N fixation is the most important source of N as a plant nutrient (Q&A #2). Through the Haber-Bosch process, hydrogen (H2) and N2 gases react under intense pressure and heat to form ammonia gas (NH3(g)) (Havlin et al., 1999). The produced NH3 can be used as anhydrous ammonia (AA) fertilizer, or for the manufacture of other N fertilizer products. AA is the highest N analysis fertilizer available and provides N at the lowest cost per pound of actual N. Urea is formed by combining carbon dioxide (CO2) with NH3 and is the highest solid fertilizer source of N. As its name implies, ammonium nitrate is equal parts ammonium (NH4+) and nitrate (NO3-) and provides both forms of plant-available N.
Q&A #2
Why have N fertilizer prices fluctuated so much in recent years?
Although atmospheric N supplies are abundant, the energy required to industrially fix N is more limited. Natural gas is the main source of energy used to synthetically fix N, with more than 70% of ammonia production costs being consumed by natural gas prices (Phillips and Mathers, 2001). In recent years, natural gas costs have increased considerably, in turn causing N fertilizer costs to rise as well. As N fertilizer use and consumption of non-renewable natural gas supplies increase, either U.S. fertilizer manufacturers are going to curtail production or prices of N fertilizers will increase to recover manufacturing costs.
Phosphorus
Unlike N fertilizers, most material for P fertilizers comes from mined rock phosphate (RP). RP is mined from raw ore deposits in various areas of the world, including Florida, Idaho, Montana, North Carolina, and Wyoming (Figure 2). RP can be used directly as a fertilizer (21-47% P2O5 ; considered organic), or used to produce other P fertilizers through either heat- or acid- treatments. The treatment of RP considerably increases P solubility and effectiveness. Ammonium phosphates (MAP and DAP) are produced by combining phosphoric acid (a product of acid-treating RP) and ammonium (NH4+) to provide a fertilizer source of both N and P. The main difference between MAP and DAP is N content: MAP (monoammonium phosphate) has one ammonium molecule for every one phosphate molecule and DAP (diammonium phosphate) has two ammonium molecules for every one phosphate molecule. Implications of this difference will be discussed later. Triple superphospate (TSP) is an orthophosphate synthesized by treating RP with sulfuric acid (H2SO4) to provide a high P analysis fertilizer. TSP is not as commercially available as it has been traditionally.
Figure 2. Phosphorus mine operation.

Potassium
K fertilizers, referred to as potash, are mined from K salt deposits found beneath the earth’s surface, in the beds of dried lakes and seas, and from salt water reserves. The world’s largest potash deposit is located in Saskatchewan, Canada, and mining also occurs in California, Israel, New Mexico, and Utah. After removal, the salts are purified and treated, yielding fertilizer compounds such as potassium chloride (0-0-60) and potassium sulfate (0-0-53-17).
Secondary Nutrients
Sulfur (S)-containing fertilizers include ammonium sulfate (21-0-0-24), elemental S0 (0-0-0-100), and dispersible, granular S0 (S0 + bentonite) (0-0-0-90). Other S sources are listed in Nutrient Management Module 6, Secondary Macronutrients. Ammonium sulfate supplies both N and S and reacts fairly rapidly in the soil. In comparison, elemental S and bentonite-S supply S more slowly to plants and effectiveness will depend on particle size, rate, method, and time of application.
Commercial Ca and Mg fertilizers are not commonly used in this region due to high Ca and Mg concentrations naturally occurring in many soils. Some amendments contain sources of Ca and Mg and will be discussed.
Micronutrients
Most micronutrients supplied in fertilizers are mined from raw ore or are by-products of industrial processes. Forms of micronutrients include oxides, carbonates, and metallic salts. Table 4 in Nutrient Management Module 7, Micronutrients lists some common micronutrient fertilizers and their chemical properties. Some metal micronutrients are ‘chelated,’ meaning a synthetic organic compound is hooked to the metal to increase solubility (see NM 7 and NM 8). Chelating agents for various micronutrient metals include EDTA, HEEDTA, NTA, DTPA, and EDDHA. Chelated forms of micronutrients are generally more expensive than non- chelated forms, but can be considerably more effective per unit of nutrient.
Fertilizer Forms
Fertilizer materials are available in either solid (dry) or liquid forms and are often blended to meet individual nutrient needs. A common question concerning fertilizer forms is whether solid fertilizers and liquid fertilizers differ agronomically. Most solid and liquid fertilizers contain the same basic nutrients and a wide range of studies have concluded that when applied under long-term conditions of equivalent nutrient rates and similar placement, liquid and solid fertilizers are essentially equal agronomically. However, because fertilizer effectiveness is dependent upon nutrient solubility and availability relative to their placement and timing, there are times when the effectiveness of the two forms can differ significantly (Wolf et al., 1985).
Solid Fertilizers
Depending on nutrient content and manufacturing processes, solid fertilizers may differ in size, shape, color, and bulk density. Solid fertilizer forms are classified by size and shape and include granules, prills, pellets, and powder. Granular fertilizer particles range in size from approximately 1 to 4 mm in diameter and are roughly round in shape (Figure 3). Granular fertilizers are the most common form of solid fertilizer used. Prills are made by solidifying free-falling droplets in air to form nearly spherical particles. Pellets are nutrients compressed into uniform sizes and nutrient content, and powder fertilizers contain fine particles (less than 2 mm diameter). In general, finer sized particles will react more quickly than larger particles due to increased surface area and contact with the soil. However, larger particles may be easier to store, handle, transport, and apply.
In recent years, many manufacturers have begun coating granular fertilizers, primarily N and P, with thin layers of substances such as clay, oils, or waxes to decrease dust production and prevent caking during packaging, transport, storage, blending, and spreading. The use of coated fertilizer has been questioned for its potential effect on nutrient availability, uptake, and yield. A recent study (Jones and Jacobsen, 2005) found that dust control coatings on MAP fertilizers from two manufacturers did not significantly decrease Olsen P soil concentrations, P uptake by corn (Figure 4), or biomass in either a low or high soil pH. In a few treatments, the coated fertilizers actually resulted in higher P availability, uptake, and growth than the uncoated fertilizers. Conclusions from this study suggest that P can readily diffuse through the fertilizer coatings and, therefore, coatings are not negatively altering fertilizer nutrient availability and yield.
Some solid fertilizers may be coated with a polymer to provide a controlled- release of nutrients and greater nutrient efficiency. These specialty fertilizers may not be cost effective for many agricultural systems, but are suitable for horticultural applications or high value cropping systems.
Blended Fertilizers
Both single and multiple nutrient fertilizers can be blended to obtain a desirable fertilizer grade or ratio of nutrients. Advantages of blending fertilizers are reduced application costs (less passes and machinery use) and a more even distribution of nutrients. Two types of blended fertilizers are homogeneous and heterogeneous (bulk blends). Homogenous fertilizers are ‘chemically’ blended to produce uniform fertilizer particles of the same nutrient content, color, and size. Heterogeneous fertilizers, on the other hand, contain one or more fertilizer materials that are ‘physically’ mixed. This generally results in components or raw materials being of various colors and sometimes sizes. Heterogeneous fertilizers are often ‘custom blended’ for individual buyers based on soil test reports.
Figure 3. Granular MAP fertilizer.
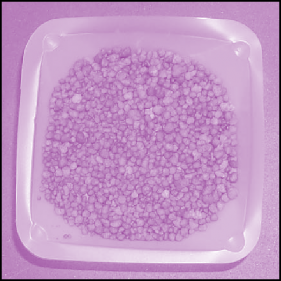
Figure 4. Effects of coatings on P uptake in corn from two MAP fertilizer manufacturers. Initial Olsen P =10 ppm and 12 ppm for low and high pH soils, respectively (Jones and Jacobsen, 2005).
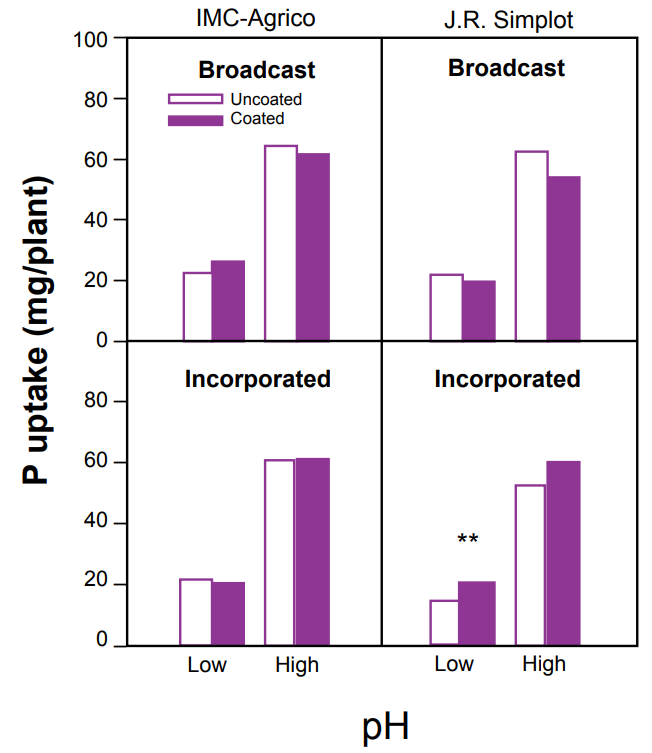
** - significant at P< 0.05
A potential problem concerning heterogeneous fertilizers is the segregation of varying fertilizer components due to different particle sizes and densities. Potash granules, for instance, have a greater bulk density than urea granules and, with jarring or movement during transport, the potash granules will settle below the urea granules. Segregation of fertilizer components can cause an uneven distribution of nutrients to a field, resulting in possible yield losses and nutrient deficiencies or even toxicities. Segregation can be reduced by using materials of similar particle sizes and thoroughly mixing the blended fertilizer in the field prior to application. Micronutrients and some solid pre-plant herbicides and insecticides can be added to blends through impregnation on the solid granule. However, a granular form with a size range similar to other components is often preferred.
Not all fertilizer materials can be blended. For instance, S-bentonite should not be blended with nitrate-N containing fertilizers and the blending of solid urea and solid ammonium nitrate results in a slushy-like mixture (Havlin et al., 1999). Before blending, the compatibility of all ingredients should be assessed.
Liquid Forms
Liquid fertilizers are fluids in which nutrients are dissolved in a water medium and include both solutions and suspensions. Solutions contain completely dissolved nutrients without solids, whereas suspensions contain some dissolved nutrients and some undissolved solid nutrients. The undissolved nutrients are held in suspension with a suspending agent, usually a swelling-type clay. To avoid settling, suspension fertilizers should be applied soon after blending (within a day or two) and some agitation may be required to homogenize the suspension before application. Some herbicides and insecticides may also be mixed with liquid fertilizers.
Advantages of liquid fertilizers are that they can be diluted or concentrated for precise, even application and are easily handled by pumps and machinery. Liquid fertilizers are commonly applied through irrigation water (fertigation), knifed-in, broadcast, or banded (NM 11). Unlike solid fertilizers, liquid fertilizers are applied on a volume rather than a weight basis and the liquid density (pounds nutrient per unit volume) is needed to calculate application rates. This information should be on the product label.
Liquid fertilizers generally have a lower nutrient analysis than solid fertilizers due to the solubility limitations of nutrients in a solution. Solutions can contain relatively high analyses of N and P, yet have low potash content because no more than 13% potash will go into solution. Therefore, most liquid fertilizers containing high analysis of potash are suspension fertilizers because the potash remains dispersed in the liquid rather than going into solution (CHPA, 2002).
Critical factors to consider when using liquid fertilizers are climate and storage. Most liquid fertilizers will ‘salt- out’ (precipitate out of solution into solid form) when temperatures become too cold. Salting-out temperatures will vary between fertilizer types and depend on content and nutrient analysis. The salting-out temperature for a given fertilizer should be stated on the product label or be available from the manufacturer. High analysis liquid fertilizers generally have higher salting-out temperatures; for instance, a typical UAN solution of 32-0-0 has a salting out temperature of 32oF, while the salting out temperature for a UAN solution of 28-0-0 is 15oF (Overdahl et al., 1991).
Furthermore, freezing temperatures can cause problems with storage containers (expansion and cracking). Liquid fertilizers should be stored in appropriate storage materials to prevent corrosion and destruction of the storage compartments. Aluminum alloys, stainless steel, and other non-corrosive materials are recommended for the storage of liquid fertilizers (CHPA, 2002).
Fertilizer Reactions in the Soil
Effects on Soil pH
Soil pH can be affected by certain fertilizer applications. Generally, soil pH is optimum between pH 6.5 and 7.5 (NM 8). Some fertilizers may change long- term soil pH after years of application, whereas others have a more short-term and ‘microsite’ effect. In this context, microsite refers to the area directly surrounding the fertilizer material and extends approximately 1 inch from the site of placement.
N fertilizers can have varying effects on soil pH. Nitrification (the conversion of NH4+ to NO3-) and hydrolysis of NH4+- based fertilizers can decrease (acidify) soil pH due to the release of H+ ions to the soil solution (Figure 5A). This reaction may have long-term effects on soil pH following years of application and may be beneficial in alkaline soils. For Montana and Wyoming soils, the magnitude of acid-forming material reactions on pH are believed to be countered by the relatively high buffering capacity of most soils in the region and possibly cropping practices (Jones et al., 2002; NM 8). However, isolated cases of lowered pH may occur; therefore, the effect of N fertilizers on pH should be considered on acidic soils.
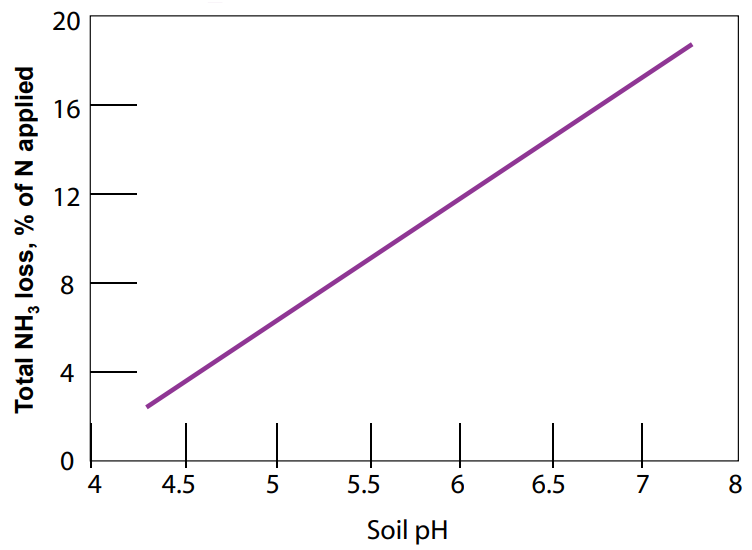
Alternatively, NH3-based fertilizers (urea, AA, and UAN) can cause soil pH to temporarily increase (become more alkaline) as a result of H+ being taken out of solution to form NH4+ (Figure 5B). This reaction occurs relatively quickly (on the order of hours to days). Volatilization of NH3 is a potential concern associated with a rise in pH following the application of NH3 fertilizers, particularly surface applied urea. Increases in pH promote the formation of NH3 in the soil, thus leading to greater NH3 volatilization at high pH levels (Figure 6). Numerous studies have shown the loss of N from volatilization to be greatest under high rates of urea applied at the soil surface, and to be substantially reduced with the incorporation of urea into the soil either mechanically or by rain or irrigation water (Fenn and Miyomoto, 1981; Overrein and Moe, 1967). In addition, studies suggest effects are greatest on soils with low buffering capacities and not as prevalent on well-buffered soils, although NH3 losses up to 60% have been recorded in some calcareous soils from surface applied urea that was not immediately watered. In a number of Montana field trials, broadcast application rates of up to 150 lb N/ac as either urea or ammonium nitrate over fall, winter, and spring did not show any significant differences in yield or protein in spring and winter wheat trials (Jackson and Jacobsen, unpublished data). This suggests that N volatilization losses from urea application are not significant in high pH calcareous soils in Montana.
Figure 5 (A and B). Effects of NH4+ (A) and NH3 (B) fertilizer applications on pH. Through nitrification, H+ ions are released to the soil, thereby decreasing pH (A). In contrast, the conversion of NH3 to NH4+ ‘takes up’ H+ from the soil solution, thereby temporarily increasing soil pH.
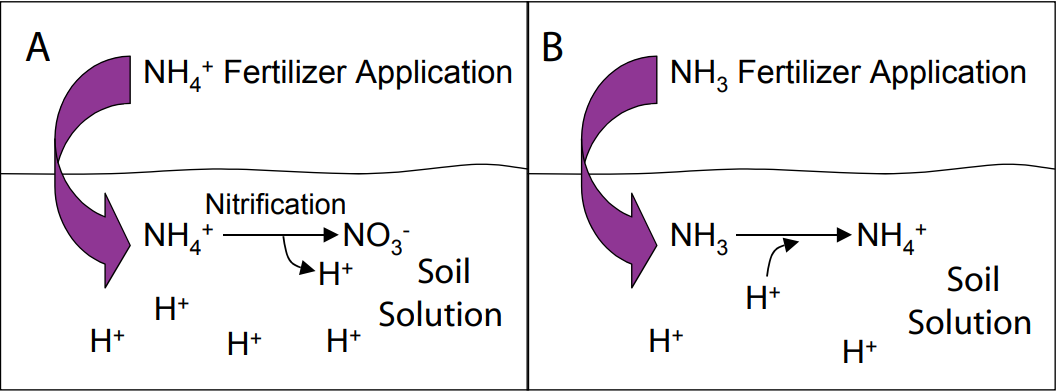
Figure 6. Effect of pH on NH3 volatilization (Fan and Mackenzie, 1993).
P fertilizers typically don’t have long-term effects on soil pH, but short-term microsite effects are evident between varying P fertilizers, including TSP (0-46-0), MAP (11-52-0), and DAP (18-46-0). TSP and MAP are acidic fertilizers that have pH values of approximately 1.0 and 3.5, respectively, whereas DAP is alkaline with a pH near 8.0. Microsite pH may temporarily shift in response to a given P application, thus possibly affecting the availability of P and other nutrients near the fertilizer granule. A study conducted in the southern U.S. looked at interaction effects between P fertilizer pH changes and NH3 volatilization when urea was applied with DAP, MAP, and TSP (Fan and Mackenzie, 1993). Results found that when urea was surface applied at 440 lb/ac with MAP or TSP, NH3 volatilization decreased as compared to urea alone, and increased when applied with DAP (Table 3). This suggests microsite pH changes attributed to P fertilizer sources can affect N loss via volatilization, and hence yield. Keep in mind, however, that soil pH change is also influenced by other factors, including soil texture, pH, and buffering capacity, which may decrease microsite effects. For example, pH changes in well buffered soils are likely minimal compared to poorly buffered soils and microsite pH will not have as considerable of an effect on nutrient reactions.
Table 3. Ammonia volatilization following constant rate of urea application with varying rates of TSP, MAP, and DAP. (Modified from Fan and Mackenzie, 1993).
| Treatment* |
NH3 loss, Site 1** |
% of urea N Site 2*** |
| Urea Alone | 4.7 | 9.8 |
| Urea + TSP | 1.8 | 4.9 |
| Urea + MAP | 4.2 | 4.1 |
| Urea + DAP | 12.8 | 14.2 |
K fertilizers may have a slightly alkaline (higher pH) effect on soil because of the addition of K+ cations to the soil solution. Most Montana and Wyoming soils are abundant in cations and the effect of K fertilizers on pH is negligible.
The acidity of a fertilizer material is measured as calcium carbonate equivalent (CCE) and is a value often listed on the fertilizer label. CCE is the number of pounds of calcium carbonate required to neutralize 100 pounds of a given fertilizer. As equivalent acidity increases, fertilizer’s acidifying effect on the soil increases, primarily due to acid produced as ammonium undergoes nitrification.
Table 4 shows some fertilizers and their equivalent acidity in pounds calcium carbonate per 100 pounds of fertilizer. Of the fertilizers listed, anhydrous ammonia and ammonium sulfate have the highest potential to acidify soil per pound of fertilizer. In summary, fertilizers can cause soil pH to change, but these effects are only expected to be substantial on poorly buffered sandy soils, which are rare in Montana and Wyoming.
Table 4. Equivalent acidity or basicity, salt index, and solubility for selected fertilizers.1
| Fertilzer Material | Equivalent Acidity2 (lb CaCO3) |
Salt Index3 | Solubility (lb material/ 100 gal water) |
| Anhydrous ammonia | 148 | 47 | — |
| Ammonium nitrate | 62 | 105 | 1,617 |
| Ammonium sulfate | 110 | 69 | 623 |
| Urea | 71 | 75 | 902 |
| MAP | 58 | 34 | 312 |
| DAP | 70 | 30 | 574 |
| TSP | Neutral | 10 | — |
| Potassium chloride | Neutral | 116 | 283 |
| Potassium sulfate | Neutral | 46 | 92 |
Salt Effect
‘Salt burn’ occurs when excessive concentrations of soluble salts come in contact with germinating seeds or roots and can result from a high rate of salt-forming fertilizers, improper fertilizer placement, irrigation with saline water, or farming on saline (high salt concentration) soils. Salts have a high attraction for water and can draw water out of seedling or root tissue, causing plant injury and drought-like symptoms to occur, particularly on sandy soils. The potential for ‘fertilizer burn’ (salt burn caused by fertilizer application) is determined by the material’s salt index. Salt index is a measure of a fertilizer’s effect on the salt level in the soil solution and is calculated by placing the fertilizer material in soil and measuring the osmotic pressure (suction) of the soil solution. As the salt index increases, the osmotic pressure increases. Fertilizers with high salt indices are more likely to cause injury to seedlings and roots than fertilizers with low salt indices. In general, N and K fertilizers have much higher salt indices than P fertilizers (Table 4). Evaluating fertilizer salt indices is particularly important when applying starter (seed and fertilizer applied together) or drill-row applications. To avoid germination damage, recommended maximum rates for N + K2O starter and drill-row applications are given by crop in Fertilizer Guidelines for Montana Crops (Jacobsen et al., 2005). With proper placement and timing of fertilizers (NM 11) and the advent of air drills, the potential for salt burn and crop damage can be minimized.
Solubility
Fertilizer solubility is a measure of how much fertilizer material will dissolve in water and is a property that strongly influences the availability of nutrientsto a crop and type of application method to utilize. Highly soluble fertilizers will dissolve easily in water and the soil solution, making nutrients available for plant uptake. Highly soluble fertilizers are required for effective fertigation (application of fertilizer with irrigation water) systems. Low solubility fertilizers,on the other hand, will not readily dissolve in water, and nutrients may precipitate, becoming less available for plants. The solubility for some fertilizers are given in Table 4 and are represented as pounds of fertilizer material that will dissolve in 100 gallons of water.
Nearly all N, K, and S fertilizers are completely water soluble, meaning all of the available nutrient is soluble. The solubility of P fertilizers, on the other hand, varies between carriers and is dependent upon manufacturing processes and composition. RP has very low water solubility (less than 1% P is water soluble), while treated RP fertilizers have relatively high solubility. For these fertilizers, total P availability is calculated as the sum of water-soluble P and citrate-soluble P (Figure 7). Citrate soluble P is P which requires a weak acid (e.g., citrate) to become soluble. To achieve high crop yields, it is suggested that superphosphates (TSP) contain high amounts of water-soluble P (greater than 90%) and ammonium phosphate materials provide between 50 and 70% water-soluble P content (Bartos et al., 1992). Because P availability is important for early plant growth, it is recommended for banded starter fertilizers to contain high soluble forms of P (greater than 60% generally). Most commercial P fertilizers supply sufficient total P solubility to meet these recommendations. Highly-soluble P fertilizers may be used in fertigation systems, although if the irrigation water contains high amounts of calcium (Ca) or magnesium (Mg), Ca/Mg-P compounds can form and precipitate. In addition to ineffective P fertilizing, this can cause scaling and plugging problems in equipment.
The solubility of micronutrient fertilizers in water will vary and is related to the process used in manufacturing and the primary product used as a micronutrient source. Because many micronutrient fertilizers are manufactured from industrial by-products and are not water soluble, most require acid-treatment to increase solubility. Chelation also improves metal solubility. Research has shown that, under similar application rates, a highly soluble micronutrient fertilizer is able to supply more nutrients to a plant than a similar fertilizer with lower water solubility (Westfall et al., 2001). Thus, to effectively supply micronutrients to crops, it is recommended to obtain fertilizers with at least 50% micronutrient water solubility (Amrani et al., 1999).
Figure 7. Example of the water-soluble P content and citrate-soluble P content for TSP.
Specific Fertilizer Reactions
Anhydrous ammonia
Anhydrous ammonia (AA) is a liquid under pressure and a gas under normal atmospheric conditions. AA is stored and transported as a liquid in a special pressurized tank and is injected into the soil. When injected into the soil, the liquid AA expands into a gas and is readily absorbed by soil moisture (Figure 8). This expansion creates a band or ‘retention zone’ of NH3 gas around the injection point. The width of this retention zone is dependent upon soil texture, water content, and temperature. AA will expand farther in sandy soils compared to finer-textured soils due to larger pore openings between sand particles allowing NH3 gas through. Finer-textured soils also have a higher exchange capacity, which better retains the NH4+ formed from NH3. The NH3 retention zone in moist soils is narrower than in dry soils, due to moisture absorbing NH3 and less air-filled pores in moist soil (more water-filled pores) that allow NH3 to expand. NH3 is highly corrosive and may temporarily sterilize microorganism populations in the retention zone. This effect is short-lived, however, and microbial activity will soon resume.
To decrease NH3 volatilization, it is recommended to incorporate AA into moderately moist soils under calm conditions and cool soil temperatures. To avoid immediate loss of NH3 gas, ensure the injection slit completely closes behind the knife. Additional guidelines for optimal conditions to minimize NH3 volatilization are given in Table 3 of NM 3. AA requires special handling and precautions should be taken to prevent hazardous injury.
Figure 8. Injection of NH3 into the soil. NH3 gas will quickly combine with water to form plant-available NH4+.

Urea
In order for urea to be an effective source of plant-available N, urease, an enzyme excreted by microorganisms that convert urea to NH4+, must be active in the soil. Urease activity is influenced by urease concentration, temperature, moisture, and pH. Due to greater biological activity, there is usually more urease present on plant surfaces and crop residues than on bare soil. Therefore, no-till or conservation till systems may experience higher urease activity than traditionally tilled systems. Urease activity is greatest between 50oF and 100oF and slows when temperatures fall outside of this range. This is why urea-N availability is delayed in cool soil temperatures with limited urease activity. Moist soil conditions and neutral to alkaline pH values (pH 6.5-9) also increase urease activity (Rachhpal-Singh and Nye, 1984).
High urease activity may further influence NH3 volatilization following urea application because of an increase in pH and a more rapid conversion of urea to NH4+ (Hargrove, 1988). For example, urea broadcast-applied to warm, moist soils with high urease activity will result in a higher concentration of NH4+ than soils with less urease activity. If the moist soil dries quickly and no additional water is supplied to move the produced NH4+ into the soil and attach to clay and organic matter particles, there is more NH4+-N subject to volatilization than in the low urease activity soil.
Fixation
In soils containing high amounts of Ca or Mg (as many Montana and Wyoming soils do), P can be ‘fixed’ and taken out of solution to form insoluble Ca/Mg-P compounds. This can affect the amount of P available for plant uptake. Studies have shown P availability and plant uptake increase when applied with a source of NH4+-N. This effect is attributed to the acidifying effect of NH4+, causing P to be more available in solution, and higher N levels in the plant, resulting in larger root masses that are able to take up more P from the soil (Blair et al., 1971; Hanson and Westfall, 1986). Larger granular P fertilizers may also be beneficial in reducing initial P fixation because larger granules contact less soil per unit of P than small granules; therefore, dissolved P is less likely to precipitate with othe