


Bull Selection Using Expected Progeny Differences (EPDs)
Bull selection is one of the most important management decisions a producer can make. Bulls are assessed phenotypically (appearance), genotypically (their genetic potential), and on performance (feed efficiency, carcass ultrasound, etc.) Bulls have a tremendous impact on the genetics of a cow herd, and according to Iowa State University Extension, the returns on investment between good and below-average sires for traits of interest can be 15% or greater.
Last Updated: 02/20by Kari Lewis, Glacier County MSU Extension Agent; Wendy Becker, Fort Peck Reservation MSU Extension Agent
THE FIRST STEP OF A BULL PURCHASE SHOULD
be to identify herd goals and determine if those traits can be improved through genetics. Selection criteria may vary depending on individual operation goals or planned matings. Calving ease is important to consider when breeding replacement heifers, while more customized matings can be carried out with mature cows to improve weaning performance, carcass merit, etc. Single trait selection (selection based on only one feature) should be avoided as it can lead to extreme cattle types.
EPDs
Animals within a breed can be compared for their genetic potential to produce a specific trait through the use of EPDs. Breed associations calculate EPDs through a statistical calculation derived from performance data of the animal, along with its sire, dam, siblings, and progeny. Research has estimated that EPDs are nine times more accurate as a selection tool than simply using adjusted weights and ratios.
EPDs are measured in units of traits, such as pounds. For example, a bull with a +70 weaning weight (WW) EPD compared to a bull with a +60 WW EPD is expected to produce calves 10 pounds heavier if mated to the same group of cows and managed under the same conditions.
Table 1 lists some of the most commonly used EPDs. A tremendous number of additional EPDs exist for various traits, including but not limited to, yearling height, docility, additional carcass characteristics, foot score, and more.
Table 1: Commonly used EPDs
EPD |
EPDAbbr. | Unit of Measurement |
Usefulness of EPD |
Calving Ease Direct |
CED |
Difference in percentage of unassisted births when bred to first-calf | A higher CED value indicates greater calving ease when bred to first-calf heifers. |
Birth Weight |
BW |
Pounds |
Indicates a sire’s ability to transmit birth weight to his progeny, a lower value indicates calves that will be lighter at birth. |
Weaning Weight |
WW |
Pounds |
Indicates a sire’s ability to transmit weaning growth to his progeny, a higher value indicates calves that will be heavier at weaning. |
Milk |
Milk |
Pounds |
Indicates the additional pounds of calf weaned by a bull’s daughters due to milk production. As milk increases, so does a cow’s nutritional requirements. |
Yearling Weight |
YW |
Pounds |
Indicates a sire’s ability to transmit yearling weight to his progeny.As yearling weight increases so does mature cow weight. |
Ribeye |
REA |
Square inches |
Predicts the difference in ribeye size of a sire’s progeny compared to progeny of other sires. |
Marbling |
Marb |
Fraction of the difference in USDA marbling score | Indicates a sire’s ability to transmit marbling ability to his progeny. A greater value indicates greater marbling potential in offspring. |
Scrotal |
SC |
Centimeters |
Predicts the difference in transmitting scrotal size compared to other sires. A larger scrotal size is positively correlated with the fertility of the bull’s offspring. |
Accuracy and Genomically-enhanced EPDs
A bull’s EPDs are enhanced over time as more performance data is collected, particularly data on a sire’s progeny. Accuracy is a measure of confidence in an EPD. When reading EPD summaries, there is an accuracy value (ACC) ranging from 0–1 (100% accurate). If the value is closer to 1, there is greater reliability in the trait indicated from the actual animal and its relatives. Young, unproven bulls with no calf data yet, will have lower accuracy EPDs than proven sires that have several hundreds of records. Low accuracy values do not mean the sire is poor quality, it just means their EPDs are less reliable and their EPDs will change as additional performance data is reported. An accuracy rating will allow a producer to take as much or as little risk as they choose.
Cattle with genomically-enhanced EPDs have a greater EPD accuracy. For example, a genomically-enhanced Calving Ease Direct (CED) EPD is of similar accuracy to a CED EPD after that animal has recorded 28 progeny. Genomically- enhanced EPDs provide a better prediction of an animal’s future merit compared to non-genomically-enhanced EPDs. Bulls with genomically-enhanced EPDs are not necessarily superior to bulls with EPDs that have not been genomically- enhanced, but their EPDs are more accurate.
Breed Average EPD
It is also important to note that when reading EPDs, each breed has an average EPD for a given trait, not necessarily zero. Throughout the year, EPDs are frequently calculated and these averages are updated and published on breed association websites. For example, if a bull has a birthweight EPD of +1.9, and the breed average is +1.1, the bull’s calves are predicted to weigh +0.8 pounds greater than the breed average. By comparing a bull to the breed average EPDs, a producer then knows for which traits the bull is above or below average.
Using EPDs to Determine Bull Value
EPDs can be used to predict the future value of a bull’s progeny. To determine the difference in a potential bull’s value, it is best to consider current market prices and use the recommended bull to cow ratio for mature bulls of 1:25. Thus, one bull could predictably produce 25 calves per year and remain in a breeding system for four years. Table 2 compares two bulls using their EPDs.
Comparing Bulls Using EPDs
Bulls may only be compared within their breed using EPDs. Therefore, EPDs are breed specific. A Hereford bull that is +50 WW does not equal a +50 WW Angus bull; he must be compared to another Hereford bull. The USDA Meat Animal Research Center does, however, publish an annual publication that determines adjustment factors across breed EPDs. These adjustments are outside the scope of this publication.
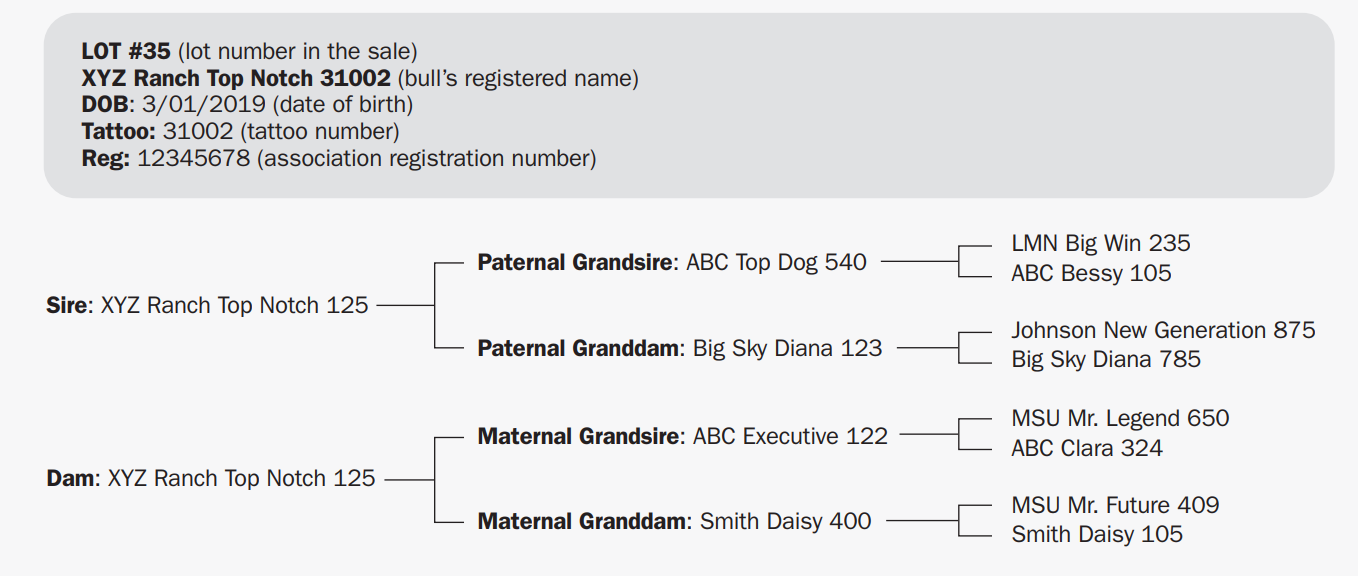
How to read the bull sales catalog example in Figure 1
Performance Data
- Birth Weight (BW) is the calf’s actual weight at birth. Adjusted Weaning Weight (AWW) is the weaning weight adjusted to account for the calf’s birth date, birth weight, and dam’s age to provide a weight adjusted to a common age of 205 days for comparison across bulls.
- Adjusted Yearling Weight (AYW) is the yearling weight adjusted to 365 days of age and accounting for the dam’s age, allowing for comparison across bulls at one year of age.
Ratios
For performance testing cattle are grouped into contemporary groups, which are a set of animals of the same sex managed under similar conditions and environment. Ratios are tools that indicate an animal’s performance within their contemporary group, with 100 being the contemporary group average. A ratio above 100 indicates greater than average performance.
- Nursing Ratio (NR) or Weaning Ratio (WR) is an indication of the animal’s performance at weaning compared to their contemporary group.
- Yearling Ratio (YR) is an indication of the animal’s performance at one year of age compared to their contemporary group.
Dam’s Production: This is the dam’s average production over her lifetime, showing her average nursing ratios and yearling ratios for the number of progeny she has produced thus far.Index: This number combines multiple performance values and an economic scenario into a single value for a various trait. In this example, $Beef Value ($B) is a terminal index representing expected average dollar/carcass difference in progeny’s postweaning performance and carcass value compared to progeny of other sires.
Genomically-enhanced EPDs: This indicates the bull’s EPDs have been enhanced by the use of genomic technology, increasing the bull’s EPD accuracy. Various genomic company logos may indicate this.
Accuracy Values: Accuracy is a measure of confidence in an EPD, ranging from 0 to 1, with 1 indicating 100% accuracy in the reliability of the EPD.
Figure 1. Sales catalog example that includes sale order, registered name, identification information, breed information, date of birth, pedigree, EPD values and accuracy values, performance data, ratios, dam information, indexes, and footnote.
----------Performance Data------------ -----------Ratio--------- ------Dam------ ---Index---
| BW | AWW | AYW | NR | YR | DAM’S PRODUCTION | $B | |
| Genomically Enhanced EPDs | 80 |
742 |
1,345 |
107 |
102 |
4 NR @ 1053 YR @ 103 | 71.50 |
| CED | BW | WW | MILK | YW | REA | MARB | SC |
| +10.34 | +1.4.52 | +69.45 | +26.28 | +103.41 | +.58.36 | +.17.35 | +.55.47 |
----------------------------------------------EPDs and Accuracy Values --------------------------------------------
- Lot 35 is a long-bodied, stout bull who ranks in the top 20% of the breed for CED, top 10% of the breed for WW EPD, and top 35% of the breed for YW
- A maternal brother topped the 2018 bull sale; selling for $16,000.
- Lot 35 is out of a top-notch cow family with two Pathfinder dams in his pedigree; Big Sky Diana 123 and ABC Clara 324. First three dams record 4 NR 103, 6 NR 110, and 5 NR 108
- Flush brother to Lots 34 and 36. This trio of bulls will add uniformity and consistency to your calf crop!
Footnote—This is subjective information, written by the breeder, and may relate to the bull’s appearance, dam, siblings, ultrasound data, performance data, if the bull was an embryo transfer (ET) calf or natural mating, etc. Remember, EPDs take into account all of the current data available and summarize that data into EPDs for the buyer’s analysis.
Table 2: Using EPDs to determine bull value
| EPD | Bull A | Bull B | Comparison |
| Calving Ease Direct | +12 | +6 | First-calf heifers bred to Bull A should have 6% more unassisted births than heifers bred to Bull B. |
| Birth Weight | +0.5 | +3.0 | Bull A’s calves, on average, would be 2.5 pounds lighter at birth than Bull B’s calves. |
| Weaning Weight | +60 | +70 | Bull A’s calves, on average, would wean 10 pounds less than Bull B’s calves. |
| Yearling Weight | +90 | +115 | Bull A’s calves, on average, would weigh 25 pounds less than Bull B’s at one year of age. |
Indexes
Many breed associations have indexes in addition to EPDs, which can be advantageous in various crossbreeding or marketing scenarios. The indexes are a number that combines performance values, such as ratios or EPD percentile ranks, into a single value for each animal. Traits of economic importance may be weighted within the index. Examples of end-product-related indexes include $B, a postweaning and carcass value index in the Angus breed), and Terminal Index (TI) which evaluates Simmental sires for use on mature Angus cows with all offspring sold on a grade and yield basis. The Baldy Maternal Index (BMI$) is a Hereford index for maximizing profit for commercial cow-calf producers in a rotational crossbreeding system. Individual breed associations offer resources on their specific economic selection indexes.
Retained Interest
Breeders will sometimes retain an interest in the bulls they sell. While specifics may vary, typically the bull is completely in the purchaser’s control for natural service use and handling. The breeder may retain a revenue-sharing semen interest to reserve the right to collect and market semen in the future. These terms will be listed in the catalog.
Summary
In addition to considering a bull’s EPDs, performance measurements, and pedigree, a bull should be thoroughly evaluated for visual traits such as structural soundness, frame size, muscling, fleshing ability, rib shape, and disposition. Many seedstock breeders provide online videos and photos of each lot prior to the sale, which can provide an additional means of viewing bulls prior to sale day. Breeders commonly have additional data sheets available on sale day that may include information not listed in the catalog, such as scrotal measurements, carcass ultrasound data, current weights, etc. There are many factors to consider when purchasing a breeding bull. Utilizing EPDs along with other available selection tools and visual analysis is extremely valuable in this important economic decision-making process.