


Climate Science 101 for Montana
Is it weather or is it climate? Weather is the condition of the atmosphere at a given time and place. Climate, on the other hand, is a longer-term or “average” condition of the atmosphere that you might expect for an area.
Last Updated: 11/16by by Brad Bauer, Gallatin County Extension Agent; Sean McKenzie, MSU Research Associate; Dr. Fabian Menalled, MSU Cropland Extension Weed Specialist; Dr. Jane Mangold, Invasive Plant Extension Specialist; Dr. Gregory Pederson, USGS Research Scientist; and Dr. Nick Silverman, Montana Climate Office
WEATHER IN MONTANA CAN VARY CONSIDERABLY
from day to day and month to month. This high variability is because we live in a semi-arid region with a cold continental climate. Generally, we receive relatively little precipitation on an annual basis. In Western Montana, the winters tend to be cold and wet with summers defined by hot and dry conditions. In Eastern Montana, the spring and summer tend to be wetter than the winter.
Weather vs. Climate
Is it weather or is it climate? Though related, the distinction between these two terms is often misunderstood. Look out the window and what do you see? Weather. Weather is the condition of the atmosphere at a given time and place (3). Climate, on the other hand, is a longer-term or “average” condition of the atmosphere that you might expect for an area (1). Climate, as defined by the World Meteorological Organization, is described using a minimum period of 30 year averages (3, a.k.a. a “climate normal”) but can be more broadly described over hundreds, to millions, of years (1). Climate may also be described by the severity and frequency of extreme events such as heat waves, cold snaps, flooding, rains, blizzards, and severe droughts. Simply put, climate tells what sort of clothes are in your closet, but the weather tells what to wear on a particular day
Weather Forecasting vs. Climate Projections
A weather forecast is a prediction generated from current atmospheric conditions that provides information about the likely temperature, wind, and precipitation over the next six to ten days. In a similar manner, future climate projections provide information on the likely condition of the climate conditions of a place over the next century (1).
The Greenhouse Effect
Most of us have heard of “the greenhouse effect.” But what is it? The earth’s climate and weather systems are powered by the radiant energy of the sun. About 30 percent of the solar energy reaching the Earth is reflected back out to space, 20 percent is absorbed by the Earth’s atmosphere, and 50 percent is absorbed by the Earth’s surface (1, Figure 1). Some parts of the Earth receive more solar energy and some receive less solar energy due to the Earth’s tilt on its axis of rotation and variability in its annual rotation around the sun. Earth’s atmosphere helps to moderate the surface temperature (1). Incoming solar radiation passes through the Earth’s atmosphere and heats Earth’s land and oceans (3). This energy is eventually reflected or radiated back towards space. However, some of it is absorbed by atmospheric gases and radiated back toward the Earth’s surface, which further heats the surface and lower atmosphere. Known as the “greenhouse effect,” this warming of our atmosphere acts like a blanket, making our Earth habitable (1). Without this natural greenhouse effect Earth's average surface temperature would be about 60°F cooler. In short, without the greenhouse effect, our planet would be too cold to inhabit.
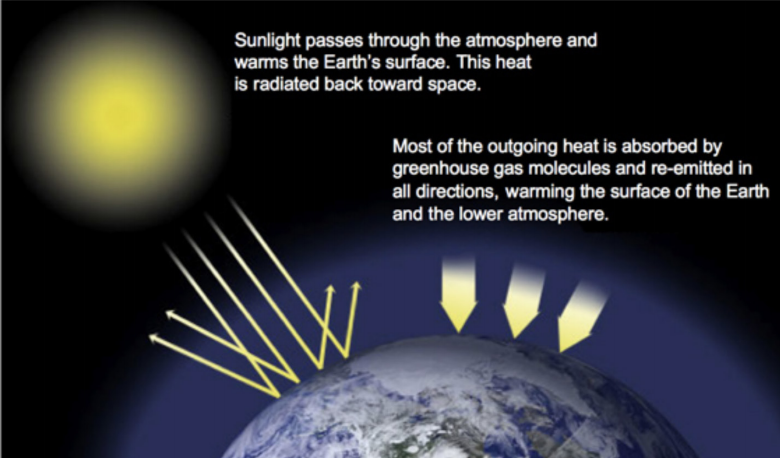
FIGURE 1. The greenhouse effect traps solar energy, heating our planet and making it habitable (Figure source: NASA)
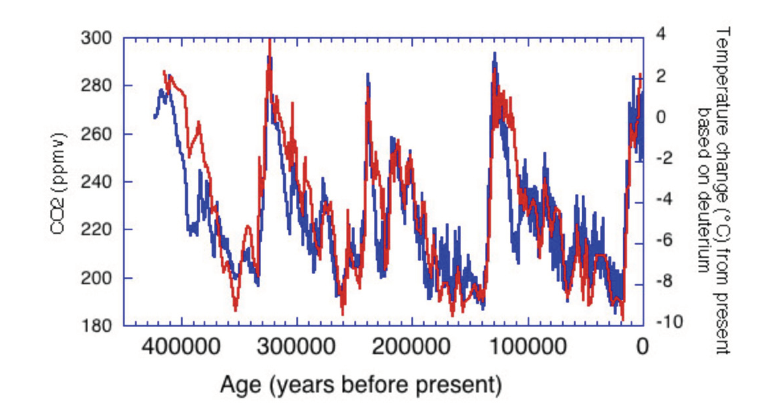
FIGURE 2. Change in carbon dioxide (red) and temperature (blue) observed in ice core records (Figure source: NOAA).
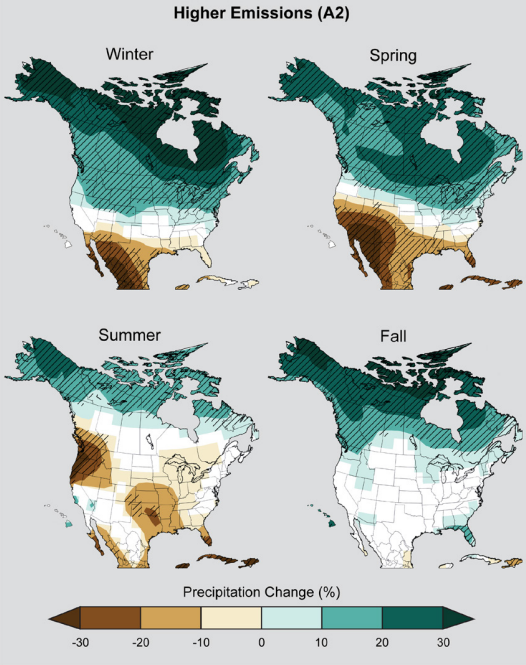
FIGURE 3. Projected change in seasonal precipitation for 2071- 2099 (compared to 1970-1999) under an emissions scenario that assumes continued increases in emissions (A2). Darker colored areas show a greater percent change. Hatched areas indicate that the projected changes are significant and consistent among models. White areas indicate that the changes are not projected to be larger than could be expected from natural variability. In general, the northern part of the U.S. is projected to see more winter and spring precipitation, while the southwestern U.S. is projected to experience less precipitation in the spring. (Figure source: NOAA NCEI/CICS-NC).
Several trace gases, which account for less than a 0.1 percent of the atmosphere, contribute to the greenhouse effect by absorbing and reradiating energy before it escapes into space (5). The major long-lived greenhouse gases are carbon dioxide (CO2 ), nitrous oxide (N2 O), methane (CH4 ), ozone (O3 ), and industrial gases (1, 3). All of these, except for industrial gases, are naturally occurring. These gases have a long lifetime in the atmosphere, ranging from about 12 to 200 years or longer, and are widely distributed throughout the Earth’s atmosphere (2).
The concentrations of greenhouse gases in the atmosphere, which set the planetary thermostat, have changed over the millennia, with relatively high concentrations being associated with high average surface temperatures (Figure 2, 1).
Climate Change through Time
The Earth’s climate has changed throughout geologic history. For example, Montana’s climate has varied substantially during the last 2.6 million years from extensively glaciated to warmer periods between glaciation. Past changes have been associated with natural causes such as: global plate tectonics (shifting of continental land masses), variation in the sun’s energy output, changes in the earth’s orbit, global volcanic activity, meteor impacts, and periodic changes in earth’s greenhouse gas concentrations (Figure 2).
Changes in global climate can occur on a timeframe as short as a 30-year period and as long as a millennia. Volcanic eruptions are an example of a natural cause of short-term climate change (6). Volcanic eruptions eject ash and sulfur dioxide (SO2 ) into the atmosphere, which temporarily blocks a portion of the incoming solar radiation, resulting in short-term global cooling (10 years or less, 1). Powerful eruptions that reach the stratosphere (8-30 miles high), such as Mt. Pinatubo in 1991, can decrease the global average temperature by nearly 1°F (0.5°C) for one or two years (1). El Niño and La Niña climate pattern oscillations, as well as the Pacific Decadal Oscillation (PDO), are other examples of natural drivers of short-term climate variability (1).
CLIMATE CHANGE OVER THE MILLENNIA
- Past increases in the concentration of atmospheric greenhouse gases are associated with higher surface temperatures.
- Past changes in earth’s climate have usually occurred slowly, i.e. over thousands of years.
- Past rapid changes in earth’s climate have often been the result of a discrete event, e.g. a volcanic eruption.
- Human activities have substantially increased the concentration of long-lived greenhouse gas in our atmosphere.
- The increase in greenhouse gas concentration in the atmosphere has resulted in warming temperatures, and the Earth may likely continue to rapidly warm over coming decades and centuries.
RECONSTRUCTING HISTORICAL CLIMATE (1, 3)
Widespread measurements of Earth’s surface temperature have been collected since around 1880; however, historic climate can be reconstructed from other historical evidence and proxy data.Historical Evidence: accounts, artistic depictions, and photographs can provide evidence on recent climate.
Proxy Data: A few examples include: ice cores, lake sediment cores, coral, and tree rings. Proxy data provides several strong examples of climate proxies from biological and geochemical processes.
- Ice cores – contain dust and air bubbles that can be used to interpret the past climate at the time the ice formed.
- Lake sediment cores – provide chemistry, pollen, charcoal, fossils and other evidence on the climate at the time the sediment was deposited.
- Coral – the hard skeletons of coral contain forms of oxygen (isotopes) that can be analyzed to determine the temperature of the water when the coral was formed.
- Tree rings – tree ring records of ring-width, density, and isotopic composition provide records of annual climate conditions. The distance between one ring and the next can reflect past seasonal drought conditions, precipitation, snowpack, soil moisture, or temperature depending on species and growing location.
Climate also changes on a much longer timescale, i.e. glacial periods and warm interglacial periods that occur over thousands of years. Long-term climate change is caused by changes in greenhouse gas composition and variability in Earth’s orbit with a resulting change in the amount and distribution of solar radiation reaching Earth's surface (7). Through proxy records, we know that Earth’s temperature has varied between 5-14°F (3-8°C) from glacial to interglacial periods resulting in major changes in Earth’s surface climate (see the box, Reconstructing Historical Climate, 3).
Human activities are also known to influence climate. We experience human-caused warming on a local scale when stepping from cool grass onto relatively hot concrete. This is known as the “urban heat island” and is the result of land use change. Humans have also increased the levels of greenhouse gas in our atmosphere (1). Sources of human-caused increases in greenhouse gases include the burning of fossil fuels, industrial processes, deforestation, and some agriculture practices (e.g. manure and soil management)(1, 7)
Since the industrial revolution, which began 200 years ago, Earth’s atmospheric concentration of greenhouse gases has increased by more than 70 percent, far exceeding pre-industrial levels (1). This increase in greenhouse gas concentrations traps more of the energy being radiated by the earth that would otherwise have escaped back to space. We have already seen that greenhouse gases set Earth’s temperature to habitable levels; however, too much greenhouse gas in our atmosphere could result in undesirable changes to surface climates that may challenge modern society. The observed increases of atmospheric and surface temperature, ocean heat content, sea level, and melting of land and sea ice are consistent with the patterns expected from rising levels of CO2 (1). Additionally, changes in temperature increase atmospheric moisture and thus alter precipitation patterns (Figure 3, 1).
Given the Earth’s history of changing climate from natural causes, how is it known that recent changes are not just part of the natural variability?
The development of climate models has enabled investigation of the Earth’s climate. Climate models are mathematical representations of past and future climate based our best knowledge of the factors affecting climate (1, 3, 7). The wide variability in model simulations comes from using an ensemble of many models (7). Even with the wide variability, climate models that only include natural factors such as the Sun’s output, Earth’s orbits, volcanic eruptions, and fluctuations such as El Niño and La Niña do not fully explain recent documented changes to our climate (Figure 4). These simulations yield little warming, or even slight cooling, over the 20th Century. Only when models include human influences on the composition of greenhouse gases and land use change are the resulting temperature changes consistent with observed changes.
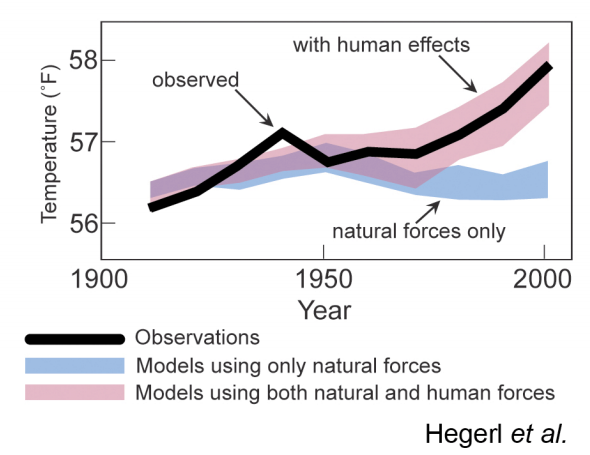
FIGURE 4. Observed average temperatures from 1900 to 2000 (black line) along with modeled temperatures. Blue shading shows models run with only natural forcings and historic greenhouse gasses (i.e. where we should be) and the red shading shows the projected temperature change with all human driven changes in land-cover and atmospheric greenhouse gas concentrations. The overlay of the observed temperature line and the red shaded area from the ensemble of global climate model runs serves as strong evidence humans have played a major role since 1960 in driving warming global temperatures. (Figure source: US Global Change Research Program)
Climate models accurately simulate past and present climate. They need to include human factors before they accurately simulate documented recent changes to our climate.
Climate MontGuide Citations
- Intergovernmental Panel on Climate Change 2013. Climate Change 2013: The Physical Science Basis. Contribution of Working Group I to the Fifth Assessment Report of the Intergovernmental Panel on Climate Change [Stocker, T.F., D. Qin, G.-K. Plattner, M. Tignor, S.K. Allen, J. Boschung, A. Nauels, Y. Xia, V. Bex and P.M. Midgley (eds.)]. Cambridge University Press, Cambridge, United Kingdom and New York, NY, USA.
- Blasing, T.J. (2014). Recent greenhouse Gas Concentrations. Carbon Dioxide Information Analysis Center. http://cdiac.ornl.gov/pns/current_ghg.html
- Farmer, G.T. 2015. Modern Climate Change Science: An overview of today’s climate change science. Springer International Publishing
- Karl, T.R., J.M. Melillo, & T.C. Peterson, (eds.) 2009. Global Climate Change Impacts in the United States. Cambridge University Press.
- Monson, R.K. & E.A. Holland. 2001. Biospheric trace gas fluxes and their control over tropospheric chemistry. Annu. Rev. Ecol. Syst. 32: 547–576.
- Langmann, B. 2014 . On the Role of Climate Forcing by Volcanic Sulphate and Volcanic Ash. Advances in Meteorology, vol. 2014
- United States Global Change Research Program 2014. Climate Change Impacts in the United States: The Third National Climate Assessment. Melillo, J.M., Richmond T.C. & G.W. Yohe, (eds.)