


Soil Sampling Strategies
Understanding different soil sampling strategies enables more accurate characterization of soil nutrient levels and variability, and therefore cost-effective fertilizer management.
Last Updated: 09/17by Courtney Pariera Dinkins, former Research Associate, Clain Jones, Extension Soil Fertility Specialist/Associate Professor, and Kathrin Olson-Rutz, Research Associate, Department of Land Resources and Environmental Sciences
THE ULTIMATE GOAL OF SOIL SAMPLING IS TO
characterize the nutrient status of a field as accurately and inexpensively as possible. Due to differences among fields combined with differences in management, there is no single optimal strategy for collecting soil samples in all production systems or even different fields within a production system. However, having a better understanding of different soil sampling strategies should help you identify strategies that fit your goals. For information on soil sampling depth and timing, interpretation of soil tests, and determining fertilizer rates see Soil Sampling and Laboratory Selection, Interpretation of Soil Test Reports for Agriculture, and Developing Fertilizer Recommendations for Agriculture listed under “Extension Materials” at the back of this publication.
Types of Sampling
Traditional soil sampling relies on obtaining soil cores that best reflect the nutrient status of a field to guide fertilizer rate recommendations. As the ability to measure yield, grain protein, and soil characteristics on-the-go in the field and correlate them with site-specific fertilizer needs increases, there should be less need for soil core samples (1). Such methods have the potential to improve fertilizer rate prediction accuracy along with net returns (2), but are beyond the scope of this MontGuide.
Soil cores can be collected either randomly, or with a plan, in which fields are broken into zones or a grid pattern (Figure 1). Subsamples within a grid pattern or in zones can be taken at random locations or in a systematic pattern. All sampling points should be georeferenced with a global positioning system (GPS) receiver and sampled in the same locations in subsequent years to track soil nutrient variation in a field, to see long-term trends, and to guide fertilizer application location.
Random Sampling
Uniform fields can be randomly sampled throughout the entire field. These samples are composited into one sample analyzed by a lab, providing one estimate of soil nutrient status for the whole field.
Grid Sampling
Grid sampling can entail taking a single soil sample at each point of a grid (or other pattern) across a field and creating one composite soil sample from which a single fertilizer recommendation per nutrient is made for the whole field. Such grid or pattern sampling avoids bias that could result from making a single composite sample out of a high number of random subsamples collected from the same region of a field. Grid sampling can also entail compositing several subsamples from around each grid intersection or within the grid squares to provide many soil test values in an even distribution across a field (Figure 1B). This can be particularly useful where there is little prior knowledge of within-field variability and for variablerate or site-specific fertilizer applications. Applying variable fertilizer rates can improve yields, reduce fertilizer costs, and reduce potential risk to ground, surface water and greenhouse gas emissions. Funding for adopting precision agriculture is available under the Environmental Quality Incentives Program (EQIP) and the Conservation Stewardship Program (CSP) from the Natural Resources Conservation Service (NRCS).
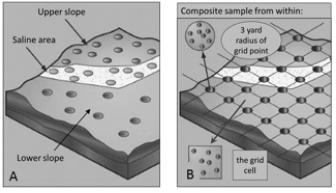
FIGURE 1. Field divided into zones (A) or a grid (B) with different subsampling options. Image adapted from 3.
Zone
Zone sampling recognizes that each field contains different areas with unique soil properties and crop characteristics, and therefore unique management zones (4). For example, areas that have had different crop history, yield or fertilizer treatments, and/or that vary substantially in slope and aspect, or soil texture, depth and/or color should be separately sampled and established as unique zones.
Samples are collected within identified zones, providing unique soil test values for each zone and allowing for variable rate fertilizer application by zone. The number of zones and their shape and size depends on the degree of field variability. There are several tools available to help delineate zones.
Soil Series Soil series zone sampling identifies areas based on soil survey maps. Each soil series differs in its soil properties and will likely have different levels of available nutrients. Therefore, separate soil samples for each soil series in a field are collected. If only one fertilizer rate is to be applied across the field, then soil test results may be area-weighted based on the acreage of each soil series. Unless the soil series maps are available at a 1:8,000 scale or smaller (termed “Order 1” by NRCS), use of digitized soil surveys to delineate zones is discouraged. Most digitized soil maps currently do not map areas that are 2.5 acres or less, making their use for variable rate nutrient management less desirable. Soil survey maps may be obtained from your local county NRCS or Extension office, or online.
Topographic/Geographic Units Topography maps are used to divide a field into ridges, slopes, and depressions which correlate with different soil nitrate-nitrogen (N), phosphorus (P), potassium (K), zinc (Zn), copper (Cu), chloride (Cl), and pH levels (5, 6). Aspect (e.g., north) is also likely to influence soil properties and yields. Soil tests can be based on one sample taken from the center of each topographic zone, or from a composite of samples collected within each topographic zone (7). Topographic maps are available as digital elevation models (DEM) produced from satellite or aerial imagery. There is a trade-off between detail (scale) and expense; highly detailed maps are relatively expensive to produce. Free DEM maps are publicly available online at USGS, though producers and their advisers could likely flag ridges, sloped, and depression areas without use of maps.
Remote Sensing Remote sensing is the process of gathering surface light or thermal reflectance data from a distance and relating that to soil or crop properties such as soil organic matter, water content, plant nutrient content, or yield. Images are collected by satellites, aircraft, unmanned aircraft systems (UAS; drones), and in-field sensors such as Greenseeker or CropSpeck. The images are then transformed into common indices such as normalized difference vegetation index (NDVI), green normalized difference vegetation index (GNDVI) or reflectance ratio vegetation index (RVI). The information is combined with digital maps into a geographic information system (GIS) to illustrate patterns of a particular soil or plant parameter within a field. Interpretation of remotely sensed indices should be groundtruthed and verified because: 1) the relationship between indices and soil or plant parameters are only estimates based on other research; 2) light reflectance of plants varies with plant growth stage; and, 3) the images are affected by illumination and viewing angles, row orientation, topography, meteorological phenomena, and other factors not directly related to agronomic properties (8).
Yield and Protein Sampling Crop growth, yield, and quality varies due to several soil parameters, such as texture, drainage, depth and management practices, including land shaping, spreader patterns and previous land use. Crop yield and grain protein maps generated from combine monitor data can be used to determine where to soil sample. A normalized frequency map1 is produced when normalized data are combined and mapped over multiple years. The resulting maps indicate zones that consistently produce average, high, or low yields and/or grain protein. See Developing Zone Soil Sampling Maps for more information.
If a factor consistently controls production variability in a field, then crop production reflects the distribution of this factor and can assist in determining where to soil sample. For example, if protein is consistently low in an area, the soil tests should reflect lower nitrogen in that area than the field average and increasing nitrogen should increase protein in those areas. However, if soil test results indicate adequate or high nutrient levels in low producing areas, then production is likely limited by a non-nutrient characteristic such as compaction, salinity, or depth to gravel. Fertilizer can then be reduced in these areas.
Management Zones The management zone approach combines a number of zone sampling techniques to establish unique management zones (Figure 1A, page 1). Combinations of prior experience, soil survey maps, yield maps, topography, electrical conductivity (EC; a measure of salinity), soil color, organic matter, soil nutrients, moisture and remotely sensed vegetation indices are all useful in establishing multiple layers of information to develop unique zones. These layers of information may be used either by themselves (described above) or in other combinations to establish unique zones.
Delineating management zones must correspond to the availability of resources and ability to apply amendments in those zones. If the capability to vary amendment rates is limited, then intensive sampling is unnecessarily expensive and can cause confusion. For practical reasons, fields are generally broken up into three to five management zones in Montana.
| CONDITIONS FOR USING GRID VS. ZONE BASED SAMPLING
Grid sampling:
Zone based sampling:
17; 29; 310; 411 |
Recommendations Based on Research Results
Representative Soil Sampling
For practical reasons, only one soil sampling strategy will generally be used. Whether to use grid or zone sampling depends on the field history and the major nutrient of interest (Box, page 2). Some soil nutrients have more spatial variability within a field than others. For example, phosphorus levels have been observed to vary more than potassium within a field (9). The greatest variability is observed in areas with long cropping histories (11). If one nutrient consistently limits yield, the method that is most accurate for that nutrient should be used.
The ideal strategy is to first determine the degree of variability within a field. If variability is low (e.g., nutrient range is less than a factor of two to three across the field) use grid sampling to create a single composite soil sample for the entire field. Use zone sampling or submit a soil sample from each grid point if variability is high. However, this requires intense initial sampling at up to a sample per acre grid. Much of our region has relatively low soil organic matter and high wind which leads to zonal distribution of soil nutrients (10). Therefore, zone sampling will detect most of the variability in a field's soil nutrient levels. Once management zones are identified, the management zone approach generally results in fewer soil samples than grid sampling, yet may take more planning time (9).
Cautions
Furrows, headlands and potholes should all be avoided (12). In addition, sampling along a straight line may bias soil sampling results if that line parallels previous fertilizer application bands.
If a specific factor, such as nutrient level, slope, or soil texture, is not a consistent predictor of yield, then zoning by that factor (e.g., slope) may produce a biased sampling plan. In addition, any factor that impacts final grain yield, such as water or early growing season temperatures, may cause discrepancy in a perceived relationship between yield and soil fertility maps (13). Remote imagery collected at a sub-optimal time of development could also affect crop yield prediction2. To reduce these discrepancies, several layers of information such as topography, soil and crop canopy images, etc., should be incorporated with yield maps to determine sampling zones (9).
Although grid sampling accounts for more nutrient variability than soil series, elevation, and management zone sampling (9), grid sampling requires sampling sites to be close enough to assure important information will not be missed. Sampling by solely soil series is generally less accurate and produces lower yields than grid sampling; however, soil series sampling has resulted in greater profits, primarily due to fewer soil samples and lower fertilizer costs (15).
TABLE 1. Number of sub-samples required to provide a composite soil sample with given levels of confidence and accuracy, and the range in nutrient level a field could have if sampled for 80% confidence 1,2.
| Accuracy Level | ||||
|
Confidence Level |
± 15% | ±25% | ||
| Percent | Number of Subsamples | |||
| 90 | 25 | 34 | 10 | 12 |
| 80 | 18 | 21 | 6 | 8 |
| 70 | 10 | 14 | 4 | 5 |
| Nutrient Range (lb/acre) | ||||
| 80 | 45-61 | 32-45 | 40-66 | 30-68 |
1 Adapted from 12
2 Example: 18 samples indicate with 80% confidence that this field has 45-61 lb nitrate-N/acre
Number of Soil Samples to Collect
The accuracy of, and confidence in, a soil test level is positively related to the number of soil samples collected per field. Accuracy measures how close the soil test value is to the actual field average, whereas confidence is how often the level of accuracy can be repeated (12). The number of subsamples required to provide given levels of accuracy and confidence for nitrogen and phosphorus are listed in Table 1. For example if 18 subsamples are combined for a N test, with a confidence level of 80% and an accuracy level of ± 15%, 14 of the 18 soil samples will have soil test values within ± 15% of the field average. Average values from the other four soil samples will be outside of this range (e.g., < 45 or > 61 lb N/acre). Sample numbers for nitrogen and phosphorus are more than enough to provide highly accurate test results for potassium.
A high desired confidence and accuracy level increases the number of collected samples. Yet to maintain a particular level of confidence and accuracy, the number of subsamples needs to be increased only slightly as field size increases. For example, at a confidence level of 80% and accuracy level of ± 15%, the optimum number of subsamples only increased from 17 to 20 for N as field size increased from 20 to 80 acres (12).
Because it is likely that only one set of subsamples will be collected, the highest number shown for a given confidence level and accuracy level should be collected (Table 1). For example, if an accuracy level of ± 25% is deemed sufficient at a 90% confidence, then 12 subsamples per field (or zone) should be collected, composited and analyzed for nitrogen, phosphorus, and potassium.
Conclusion
Because it is not practical to use different sampling strategies for different nutrients within a field, choose between grid or management zone sampling based on the field history and major nutrient of interest. Practically speaking, the time required to obtain soil samples and the sampling budget dictate the number of soil samples that should be taken. However, incorporating an appropriate sampling strategy will provide the best, most cost-effective determination of available nutrients.
Acknowledgements
We appreciate the time and expertise of the following for review and production of this document:
- Mr. Terry Angvick, Producer, Plentywood, Montana
- Dr. David Franzen, Extension Soil Specialist, North Dakota State University, Fargo, North Dakota
- Mr. Chuck Gatzemeier, Certified Crop Adviser, CG Ag Consulting, Cut Bank, Montana
- MSU Extension Communications & Publications
Extension Materials
For online or printed copies of the first three contact MSU Extension Publications, (406)994-3273.
- Developing Fertilizer Recommendations for Agriculture (MT200703AG)
- Interpretation of Soil Test Reports for Agriculture (MT200702AG)
- Soil Sampling and Laboratory Selection (4449-1)
- Developing Zone Soil Sampling Maps (SF-1176-2)
References
- Sinfield, J.V., D. Fagerman, and O. Colic. 2010. Evaluation of sensing technologies for on-the-go detection of macronutrients in cultivated soils. Computers and Electronics in Agriculture. 70:1-18.
- Barroso, J., P. Lawrence, C. Merja, and B. Maxwell. 2013. Spatial Optimization of Nitrogen Application for Wheat. Fertilizer Facts No. 65.
- IPNI, International Plant Nutrition Institute. 2012. 4R Plant Nutrition: A Manual for Improving the Management of Plant Nutrition. International Plant Nutrition Institute, Norcross, Georgia, USA. 66p.
- Fleming, K.L., D.G. Westfall, D.W. Wiens, and M.C. Brodahl. 2000. Evaluating farmer defined management zone maps for variable rate fertilizer application. Precision Agriculture. 2: 201-215.
- Franzen, D.W., A.D. Halvorson, and V.L. Hofman. 2000. Spatial nutrient relationships and profitability of variable-rate fertilizer application in a wheat and sunflower rotation. p. 88-93. In: Great Plains Soil Fertility Conference Proceedings. 7-8 March, 2000, Denver, CO. A. Schlegel [Ed.]. Potash & Phosphate Institute, Brookings, SD.
- Franzen, D.W., T. Nanna, and W.A. Norvell. 2006. A survey of soil attributes in North Dakota by landscape position. Agronomy Journal. 98:1015-1022.
- Franzen, D.W., L.J. Cihacek, V.L. Hofman, and L.J. Swenson. 1998. Topography-based sampling compared with grid sampling in the Northern Great Plains. Journal of Production Agriculture. 11: 364-370.
- Pinter, P.J. Jr., J.L. Hatfield, J.S. Schepers, E.M. Barnes, M.S. Moran, C.S.T. Daughtry, and D.R. Upchurch. 2003. Remote Sensing for Crop Management. USDA-ARS/UNL Faculty Paper 1372.
- Mallarino, A.P., and D.J. Wittry. 2004. Efficacy of grid and zone soil sampling approaches for site-specific assessment of phosphorus, potassium, pH, and organic matter. Precision Agriculture. 5: 131-144.
- Franzen, D. Personal communication. 2017. Extension Soil Specialist, Department of Soil Science, North Dakota State University. Fargo, North Dakota.
- Mallarino, A.P., D.B. Beegle, and B.C. Joern. 2006. Soil sampling methods for phosphorus-spatial concerns. Southern Education Research Activities (SERA) 17, United States Department of Agriculture.
- Swenson, L.J., W.C. Dahnke, and D.D. Patterson. 1984. Sampling for Soil Testing. North Dakota State University, Department of Soil Sciences, Res. Rep. No. 8.
- Lobell, D.B., J.I. Ortiz-Monasterio, G.P. Asner, R.L. Naylor, and W.P. Falcon. 2005. Combining field surveys, remote sensing, and regression trees to understand yield variations in an irrigated wheat landscape. Agronomy Journal. 97: 241-249.
- Moges, S.M., W.R. Raun, R.W. Mullen, K.W. Freeman, G.V. Johnson, and J.B. Solie. 2004. Evaluation of green, red, and near infrared bands for predicting winter wheat biomass, nitrogen uptake, and final grain yield. Journal of Plant Nutrition. 27: 1431-1441.
- Clay, D.E., J. Chang, C.G. Carlson, D. Malo, S.A. Clay, and M. Ellsbury. 2000. Precision farming protocols. Part 2. Comparison of sampling approaches for precision phosphorus management. Communications in Soil Science and Plant Analysis. 31: 2969-2985.