


Home Garden Soil Testing & Fertilizer Guidelines
Soil testing and interpreting your soil test results are useful for developing fertilizer rates specific to your garden.
Last Updated: 10/18by Courtney Pariera Dinkins, Research Associate; Clain Jones, Extension Soil Fertility Specialist/Assistant Professor; and Kathrin Olson-Rutz, Research Associate, Department of Land Resources and Environmental Sciences
THIS GUIDE PROVIDES HOME GARDENERS AND
Extension agents the tools to better understand and interpret soil test reports. This understanding should help the reader accurately determine fertilizer rates and the need for soil amendments, such as compost. The data in soil test reports are only worthwhile if the tested soil sample accurately represents the sampled garden; therefore, a summary of sampling methods is provided.
Soil Testing Versus Standard Fertilizer Rates
Due to time and the cost of soil analysis ($20-$50) compared to the cost of fertilizer for a small yard area, many gardeners do not soil test but instead use standard fertilizer rates (Table 1, page 2) which are often given on fertilizer bags. If you are using standard fertilizer rates and your plants appear healthy, we recommend continuing your current fertilizer regimen and soil sample only if you wish to reduce the risk of, or diagnose, a potential nutrient deficiency or toxicity. If you have been using standard fertilizer rates and your plants are not thriving or producing well, soil testing may be the only way to determine if your garden has abnormal levels of nutrients. Although it is often thought that ‘more is better’, gardens can have excessive nutrient levels due to high inputs of compost and/or fertilizer. Excessive levels of fertilizer are not only a waste of money, but can be harmful to your plants and the environment.
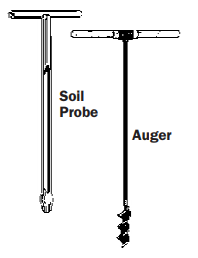
FIGURE 1. Soil sampling hand probe and auger.
Please see the Montana Master Gardener Handbook for more information on standard fertilizer types and amounts for gardens, lawns, shrubs and trees. The web address and ordering information for all Extension documents referenced in this MontGuide are listed at the back of this publication.
Soil Sampling
To obtain meaningful and accurate soil test results, it is important that you correctly collect soil samples from multiple locations within your yard and garden. A minimum of ten samples should be collected and mixed from your garden, or from each 1,000 square feet (sq ft) of lawn to obtain a representative sample. Be sure to remove any mulch or lawn thatch before collecting your soil samples. If there is a visual or textural difference from one side of your garden or lawn to the other, submit separate samples. Samples may be submitted moist or dry. If you decide to soil sample in mid- summer or fall, it is best to wait at least two months after fertilization to give the fertilizer a chance to dissolve, disperse and be used by plants.
Soil samples are best collected using hand probes or augers (Figure 1). Unless it is the only option, you should avoid shovels and spades because it is difficult to obtain the same amount of soil from each depth and location with these tools, possibly biasing results. Hand augers are useful, especially when sampling at different depths. Many Extension offices have hand probes or augers and may either lend you the tools or assist you in soil sampling. An alternative tool to collect a 0 to 6 inch soil sample is a bulb planter (available at most gardening stores). Tools should be cleaned between each garden or area sampled and stored away from fertilizers to prevent contamination.
Sampling Depth and Time
For home gardens, lawns and trees, soil samples are generally a 6 inch deep core from the soil surface. In some cases, soil samples may also be taken below the 6 inch depth. Because nitrogen (N, in the form of nitrate-N), sulfate-sulfur (sulfate-S) and chloride (Cl) are very soluble and can more readily move down into the soil than other nutrients, deeper soil samples can be collected and analyzed for these nutrients.
TABLE 1. Standard rates of fertilizer for lawns, gardens and trees/shrubs.
| Location | Total Amount | Amount per Application | Notes |
| Lawns | 3 lb N per 1000 sq ft per year | 1 lb N per 1000 sq ft | Apply Memorial Day, Labor Day and Columbus Day |
Gardens |
20 lb 10–10–10per 1000 sq ft per year |
10 lb 10–10–10per 1000 sq ft |
Apply prior to planting and later between rows to avoid plant burning |
| Apply 3rd application for high N demanding plantsa | |||
Trees/ Shrubs |
1 lb of 10–10–10 per inch diameter at breast height or 1 lb N per 1000 sq ft drip line | 1 lb of 10–10–10 per inch diameter at breast height or 1 lb N per 1000 sq ft drip line | No need for additional fertilizer if plant lies within your fertilized lawn |
aBeets, corn, onions, potatoes, rhubarb, spinach, strawberries, sunflowers and tomatoes
You should schedule soil sampling to allow adequate time for soil analysis (~one to two weeks) and fertilizer application, if needed, prior to seeding or planting time. Also, soil tests are representative of current nutrient levels and do not necessarily reflect future conditions. Therefore, soils are ideally sampled yearly in the spring to best estimate growing season nutrient availability; however, it may be more practical to test soil in the fall when soil is dry and there are fewer time constraints. Unfortunately, fall samples do not always represent the true amount of N that will be available at spring planting, because some N is released from organic matter (O.M.) during the winter months in a process called ‘mineralization’. Conversely, soil nitrate can be lost to leaching during wet winters, especially in shallow or sandy soils. Fall N levels will be similar to spring N levels if the fall and winter are cold and dry, because both conditions reduce N mineralization and leaching. Contact your local Extension agent for more information on soil sampling or refer to MSU Extension’s Nutrient Management Module 1 (#4449-1).
Soil Testing Laboratories
The time spent selecting a good laboratory can quickly pay for itself in the form of accurate fertilizer recommendations and desired plant responses. Laboratories that are part of the North American Proficiency Testing Program (NAPTP) or Agricultural Laboratory Proficiency Program (ALP) should provide you with analysis results of soil samples that have known nutrient levels. A fairly high degree of variability has been observed among laboratories (Jacobsen et al., 2002); therefore, it is best to send soil samples to the same laboratory each time to ensure consistency. Regional analytical laboratories are listed in the Appendix.
Some laboratories have standard packages that test for common nutrients and other soil parameters. At a minimum, have your soil tested for N, phosphorus (P), potassium (K), O.M., soluble salts and pH.
Tissue Analysis
In Montana, plant tissue sampled periodically during the growing season and tested for nutrient deficiencies has often led to inconsistent results, due to inconsistent tissue sampling, handling, preparation and shipping (Jackson, pers. comm.). Because it takes a couple of weeks between sending tissue samples, receiving test results, and purchasing/applying fertilizer, plant growth may have already been decreased by the time fertilizer is applied. Therefore, it is recommended that you identify potential nutrient deficiencies by soil testing prior to the growing season. If you decide to tissue test, please contact your local Extension agent for specific information on tissue sampling and sample preparation.
Some nutrient deficiencies can be detected by observing plant growth (Table 2 and Nutrient Management Module 9 for an expanded deficiency key). However, plant symptoms are not always consistent and can be caused by a combination of nutrient shortages. Beware of pseudo-deficiencies caused by herbicides, disease, insects, salinity, or moisture stress that look like nutrient deficiency symptoms.
TABLE 2. Plant symptoms that indicate potential nutrient deficiencies.
| Nutrient | Appearance | Location on Plant | Plant Stature |
| Calcium | Dark green and distorted leaves, leaf tips dry and brittle | Young leaves | Blossom end rot in tomatoesa and peppers, tip burn in cabbage, weak stems, poor germination |
| Iron | Sharp distinction between green veins and yellow between veins | Upper, new leaves | Stunted under severe deficiency |
| Nitrogen | Yellow | Low, older leaves | Small leaves |
Phosphorus |
Dark green to purple, mottled or bronze as mature | Low, older leaves, stems and veins, especially on underside | Young leaves unusually small, possible very thin stems, or very lush and healthy but no flowers/ fruit |
| Potassium | Grey-green, mottled, yellow, scorched leaf edge | Low, older leaves | Plant wilted, stunted, lacking vigor, small misshapen fruit |
| Sulfur | Light green to yellow | Upper, new leaves | Small thin stems, delayed maturity |
a Refer to the MSU Extension Montguide Growing Tomatoes in Montana (MT199217AG) for more information on blossom end rot.
Soil Test Data Interpretations and Fertilizer Guidelines
An example soil test report is shown in Figure 2 . Each laboratory uses a somewhat different format, but the overall information is generally similar. Soil test results may include a fertilizer recommendation, though they may not be based on Montana guidelines or are for agricultural rather than home vegetable garden production. Guidelines shown in this document are for the entire state of Montana and they may need to be adjusted for your location. For example, if you are in a warmer location, you may increase your fertilizer amounts due to higher plant growth and nutrient needs; conversely, if you are in a cool area, you should slightly decrease your fertilizer amounts. Similarly, if your plants receive less than optimal water, you should reduce your fertilizer rates.
One season’s harvest of the edible portion of garden vegetables removes on average 2-3 lbs N, 0.5 lbs P2O5, and 3 lb K2O per 1000 sq. ft. of garden.
(Morris et al. 2007)
Nutrient Classes
Your soil test results will typically indicate whether a nutrient level is low, medium (moderate) or high (adequate). These levels are known as ‘nutrient classes’, or categories, and some labs may break these classes down further to very low, low, medium, high and very high. The cutoff between a medium and high level is sometimes referred to as a ‘critical level’ and provides a value that indicates when fertilizer should (below critical level) or should not (above critical level) be added. Once soil nutrients are brought up to high or critical levels, whether with conventional fertilizer or organic material, only enough nutrients need to be added annually to replace those lost to leaching or removed by harvest (see text box above). Ideally you should soil test every few years to monitor your fertility management.
Macronutrients
Macronutrients that may be tested in your soil include N, P, K, sulfur (S), calcium (Ca) and magnesium (Mg). Nitrogen, P and K are considered ‘primary’ macronutrients because they are required in higher quantities and are deficient more often than S, Ca and Mg (‘secondary’ macronutrients). In general, Ca and Mg are present in quantities well above necessary levels in Montana soils; however, artificial Ca deficiency may develop with water stress.
Nitrogen
Soil tests generally measure nitrate-N because it is the best indicator of plant available N, and report N in pounds per acre (lb N/acre) or parts per million (ppm). For the remainder of the document, nitrate-N will be referred to as N.
Nitrogen guidelines based on soil test levels and O.M. are given in Table 3 on the following page. The section “Fertilizer Grade and Rate Calculations” explains the calculation of actual fertilizer application rates. If you are using a fall soil sample, then rates may need to be adjusted because available N can change over winter. If fall nitrate levels are low (<10 lb N/acre or <5 ppm in upper 6 inches), then leaching loss is not a big concern. If they are high (>40 lb N/ac or >20 ppm), then there could be substantial leaching in a wet fall/winter. If O.M. is high (>5%), then N will likely increase from fall to spring due to N release from the O.M. Basing spring fertilization rates on a fall soil test in a wet year could lead to under fertilization, whereas in a dry year a fall soil test could lead to over fertilization.
Soil N can be increased by growing legumes (beans, peas). Rotating these N-fixing plants with heavy feeders (broccoli, corn, lettuce, potatoes) can help manage soil N and ensure efficient nutrient use throughout the garden.
FIGURE 2. Sample soil test report and fertilizer recommendations.
| Name: Homeowner Sample Date: April 9, 2007 | |||
| Lab Number: 12345 Your Sample Number: 1 | |||
| Crop to be Grown: Garden Sampling Depth: 0 to 6 inches | |||
| Soil Test Results | Interpretation | Recommendation | |
| Nitrate-N | 12 lb/acre | Low | 3 lb N/1000 sq ft |
| 6 ppm | |||
| Olsen Phosphorus | 15 ppm | Medium | 2 lb P2O5/1000 sq ft |
| Potassium | 192 ppm | Medium | 1 lb K2O/1000 sq ft |
| Sulfate-S | 15 ppm | High | |
| Boron | 0.5 ppm | Medium | 0.02 lb B/1000 sq ft |
| Copper | 1.7 ppm | Very High | |
| Iron | 47 ppm | Very High | |
| Manganese | 10 ppm | Very High | |
| Zinc | 1.3 ppm | High | |
| Soluble Salts | 0.3 | Low | |
| Organic Matter | 3.4% | Medium | |
| Soil pH | 7.7 | Medium/High | |
| CEC | 17.8 | Medium | |
| Soil Texture | Sandy Loam | ||
TABLE 3. Nitrogen fertilizer guidelines based on soil test results and organic matter level. Soil nutrient class for N is plant dependent.
| Soil Test | Organic Matter (%) | |||
| Nitrate-Na | Location | < 1.5 | 1.5 – 3. 0 | > 3.0 |
| lb/acre | lb N/1000 sq ft | |||
< 20 |
Lawns | 6 | 5 | 4 |
| Trees/Shrubsb | 3 | 2 | 2 | |
| Gardens | 4 | 3 | 3 | |
20 – 40 |
Lawns | 4 | 3 | 2 |
| Trees/Shrubsb | 2 | 1 | 1 | |
| Gardens | 2 | 2 | 2 | |
40 – 80 |
Lawns | 2 | 1 | 1 |
| Trees/Shrubsb | 1 | 0.5 | 0 | |
| Gardens | 1 | 1 | 0.5 | |
| > 80 | All | 0 | 0 | 0 |
Phosphorus and Potassium
Unlike N, P is highly immobile in the soil and in most Montana soils high levels of Ca tie up P, making it relatively unavailable to plants. Montana has among the lowest soil test P levels in the country (PPI, 2005). There are three major soil tests used for available P: the Bray- 1 and Mehlich-3 tests for acidic soils, and the Olsen P test for neutral to alkaline soils. In Montana’s alkaline soils, P is typically tested using Olsen P, also known as bicarbonate P. Unfortunately, Bray and Mehlich test results do not convert easily to Olsen P, and because P fertilizer guidelines in Montana are based on Olsen P, you should ask your soil testing lab to only test for Olsen P. Olsen P is fairly robust and works well at pH above and below 7. Bray, however, does not work well at pH levels higher than 7.
Potassium is also immobile in the soil, though not as immobile as P. Potassium soil tests will be lower in late summer than early spring, because plants will have removed K from solution and from the edges of soil particles. The highest and most accurate K levels will be measured in the spring just after the soil thaws and before plant uptake becomes substantial. Plants can continuously absorb K beyond their requirements, and high levels of K can result in other nutrient deficiencies, so it is important to test soil for K to reduce over-fertilization. See tables 4 and 5 for recommended P and K fertilizer guidelines.
Sulfur
In many Montana soils, responses to S fertilizer are much less consistent than for P and K, partly because available S below 6 inches can be very high due to high levels of gypsum (CaSO4?2H2O). In addition, soil tests for S sometimes do not accurately reflect S availability. Due to these inconsistencies, MSU does not have S guidelines based on soil tests.
The highest likelihood of S increasing plant growth occurs on coarse (sandy), shallow soils which generally contain little gypsum and do not retain S well. The best way to determine if your plants are S deficient is to look for uniform yellowing on the youngest leaves (Table 2). If S is needed, an application of 0.3 to 0.5 lb of S/1000 sq ft is recommended.
Micronutrients
Mineral micronutrients are naturally present in the soil and required by plants in lower quantities than macronutrients, yet are no less important. They include boron (B), chloride (Cl), copper (Cu), iron (Fe), manganese (Mn), molybdenum (Mo), nickel (Ni) and zinc (Zn). Because micronutrient deficiencies are uncommon, there has been little work in Montana to determine plant-specific micronutrient requirements. However, some plants are more prone to micronutrient deficiencies than others. For example, Fe deficiencies are very common in members of the Rose family, as well as ash, apple, crabapple and some maple trees.
In general, Ni and Mo are more than adequate in Montana soils and will not be discussed further. Table 6 lists soil nutrient classes based on nutrient concentrations (ppm) for Montana soils. Apply metal micronutrient (Cu, Fe, Mn and Zn) fertilizers either in a band 1 to 2 inches below the seed (‘banding’) or on the leaves (‘foliar applications’) rather than on the soil surface, because metals are very immobile in the soil. Micronutrients should not be added unless indicated by a soil test, as excess can be detrimental.
TABLE 4. Phosphorus nutrient class and fertilizer guidelines based on soil tests.
| Olsen Pa | Nutrient Class | Gardens | Lawns | Trees/Shrubs |
| ppm | ..... lb P2O5 /1000 sq ft ..... | |||
| < 4 | Very Low | 5 | 3 | 3 |
| 4 – 8 | Low | 4 | 2 | 2 |
| 8 – 12 | Medium Low | 3 | 1 | 1.5 |
| 12 – 16 | Medium | 2 | 0 | 1 |
| 16 – 30 | High | 1 | 0 | 0 |
| >30 | Very High | 0 | 0 | 0 |
aSodium bicarbonate extractable P, 0-6 inch sample depth
TABLE 5. Potassium nutrient class and fertilizer guidelines based on soil tests.
| Soil test Ka | Nutrient Class | Gardens | Lawns | Trees/Shrubs |
| ppm | ..... lb K2O/1000 sq ft ..... | |||
| < 75 | Very Low | 3 | 4 | 2 |
| 75 – 150 | Low | 2 | 3 | 1 |
| 150 – 250 | Medium | 1 | 2 | 0.5 |
| 250 – 500 | High | 0 | 1 | 0 |
| >500b | Very High | 0 | 0 | 0 |
aGrade should be selected to best match the amount of N, P and K recommended in your soil test report
CALCULATION BOX. Fertilizer requirements for the home garden based on nitrogen needs from the sample soil test report (Figure 2).
Nitrogen requirement for soil with 3.4% organic matter and < 20 lb N/acre: 3 lb N/1000 sq ft (Table 3)
APPLICATION RATE:
Using a fertilizer blend of 10–15–10a, meaning 10% N (0.10 lb N/lb fertilizer), 15% P2O5 and 10% K2O