


Using Growing Degree Days to Predict Plant Stages
It’s tough to predict plant growth based on the calendar because temperatures can vary greatly from year to year. Instead, growing degree days, which are based on actual temperatures, are a simple and accurate way to predict when a certain plant stage will occur.
Last Updated: 07/18by Perry Miller, MSU Assistant Professor, Will Lanier, IPM Assistant, and Stu Brandt, Ag Canada agronomist
This research on plant growth stage response to growing degree days was completed in the mid 1990s at two locations in semiarid Saskatchewan by Perry Miller and Stu Brandt, research scientists at that time with Agriculture and Agri-Food Canada. This has been by far the most popular Extension article in Perry Miller’s career at MSU. This type of information is rarely collected in such a comprehensive manner and plant species growth rates are a highly conserved aspect, with only minor variation due to cultivar differences. Thus, this information is expected to be somewhat ‘timeless’. In 2018, we initiated a 3-year follow-up study in Bozeman that will provide additional information on plant-specific growth rates.
PLANT DEVELOPMENT DEPENDS ON TEMPERATURE.
Plants require a specific amount of heat to develop from one point in their lifecycle to another, such as from seeding to the four-leaf stage.
People often use a calendar to predict plant development for management decisions. However, calendar days can be misleading, especially for early crop growth stages. For example, a cool May can greatly delay a plant reaching the four-leaf stage, which affects optimal weed control tactics. Or two weeks of hotter-than-normal July weather can advance lentils from green pod to harvest-ready, meaning you should have had the combine in the field three days ago! Research has shown that measuring the heat accumulated over time provides a more accurate physiological estimate than counting calendar days.
The ability to predict a specific crop stage, relative to insect and weed cycles, permits better management. This is especially important when three or more crops are being grown on the same farm, each with a different management schedule for pesticide application, fertility management and harvest.
Degree day calculations
Though temperatures often average out from year to year over an entire growing season, there are usually cooler- or warmer-than-normal times during significant parts of the growing season. As the saying goes, “normal” weather is an average of extremes. Warmer-than-normal days advance the plant and insect growth rapidly, while cooler- than-normal days slow them.
“Growing degree days” (abbreviated GDD or DD) is a way of assigning a heat value to each day. The values are added together to give an estimate of the amount of seasonal growth your plants have achieved. Degree days are easy to calculate:
- Add each day’s maximum and minimum temperatures throughout the growing season,
- divide that sum by two to get an average, and
- subtract the “temperature base” assigned to the plant you are monitoring. (Temperature base is the temperature below which plant development stops).
The resulting “thermal time” more consistently predicts when a certain plant stage will occur. When summed together, these thermal times are sometimes referred to as a “thermal calendar.”
Figure 1 (page 2) illustrates the relationship between time, temperature and the accumulation of degree days. One degree day is one day when the average daily temperature is at least one degree above the lower developmental threshold (the temperature below which development stops). For example, if the low for the day was 33°F and the high was 67°F, then the day had an average temperature of 50°F. If a plant had a temperature base of 32°F, like wheat does, then that day counts as 18 DD on the Fahrenheit scale (67 + 33 / 2 - 32 = 18).
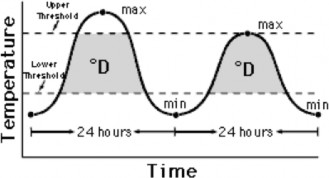
FIGURE 1. Thresholds and degree-days. Note: It takes nine Fahrenheit degree-days to make five Celsius degree-days. DD°C = 5/9 (DD°F) and DD°F = 9/5 (DD°C).
Table 1 shows the growing degree days required to reach various plant stages for several crops. The range in reported GDD values encompasses 95 percent of the observations taken at two sites in Saskatchewan. Many locations in Montana offer a running tally of degree days, allowing accurate tracking of plant and insect development. The web site http://uspest.org/wea/ has a degree day report, and the report is also published in the Montana Crop Health Report available from the MSU Entomology Department for a small fee.
Accumulated degree days
Each developmental stage of an organism has its own total heat requirement. Development can be estimated by accumulating degree days between the high and low temperature thresholds throughout the season. The date to begin accumulating degree days, known as the biofix date, varies with the species. Biofix dates are usually based on specific biological events such as planting dates or first occurrence of a pest. Accumulation of degree days should be done regularly, especially when a control action decision is near.
Common questions and answers
What are degree days and what are they used for?
Degree days are commonly used in agriculture and natural resources management to predict events and schedule management activities, such as when to sample or control a pest.
What is a biofix?
A biofix is the date to start accumulating degree days for a particular plant. Examples are the first date a weed seedling is observed or the date tree buds start to break. Degree days are reset to zero at the biofix date, no matter how many were accumulated before that.
How do I interpret degree day calculations?
Degree days can take some of the calendar variations out of predicting events influenced by temperature. For example, compare a growth stage calculation using calendar days and degree days: The fifth-leaf stage of wheat occurs either at an average of 21 calendar days after germination or 350 degree days after germination. If you used calendar days, you would have a potential error of plus or minus nine calendar days. Using an estimate of 350 degree days, the potential error is two to three calendar days. The difference is important if you are trying to schedule weed control and a herbicide that is most effective after the fifth-leaf stage.
To fine tune weed control efforts, observe germination, then add up the degree days every day thereafter until 350 degree days accumulate, when you can expect the fifth-leaf stage to occur.
Where are degree day reports available and how do I use them?
Degree day reports are created using weather monitoring networks coordinated by the National Oceanic and Atmospheric Administration (NOAA). In Montana, the Great Falls National Weather Service produces a report every evening that supplies basic degree day information for many sites across Montana. See a summary of this report at http://IPM.montana.edu. The report can factor in elevation, terrain and local effects to show degree day accumulations over a given time period, for a large or local area. Accurate management decisions are possible by monitoring these reports and applying them to growing conditions and management decisions.
Crop development
The stages and the duration of the stages through which a maturing organism passes are determined by climate, soil fertility, cultural practices and genetic make-up, to mention a few. Timing of many management practices like weed and insect control, applications of fertilizer or the decision to reseed in the event of winter kill or cutworm damage are usually determined by crop development stage. Several numbering systems or scales have been developed for naming and describing crop stages. As these scales became more widely used and degree day- based growth stage (phenology) models were developed, it was apparent that combining crop staging information could forecast management practices. In Table 1, growth stage calculations using 0°C and 32°F base temperatures are combined with the Universal Growth Staging Scale descriptive terms for crops grown in Montana.
Growth stage (phenology) models
Growth stage models predict the time of stages in an organism’s development using developmental thresholds. Upper and lower developmental thresholds have been determined for some organisms through carefully controlled laboratory and field experiments. For example, the winter wheat lower developmental threshold, or base temperature, is 32°F and the upper developmental threshold is 130°F (winter wheat crop model of Karow et al. 1993).
The lower developmental threshold temperature or base temperature for an organism is the temperature below which development stops. The lower threshold is determined by the organism’s physiology and is independent of the method used to calculate degree days. Base thresholds vary with different organisms, but for cool season crops grown in Montana, 0°C (32°F) is often the best base temperature for predicting development. The upper developmental threshold is the temperature above which the rate of growth or development begins to decrease or stop. Determining a consistent upper threshold is difficult. Often, they are unavailable for use in phenology models, and may occur at higher temperatures than typically seen in Montana. Growth models start accumulation of degree days at a starting point, usually the base temperature. These models do not indicate whether control is warranted, but rather when a pest will reach susceptible life stages. If pests are abundant, such models help eliminate the guesswork when choosing a time for a control action.
Note: Phenology models, especially in Montana, are affected by available moisture. For example, there must be sufficient seedbed moisture to begin the germination process. If sufficient moisture does not exist at seeding, a model starts accumulating degree days coinciding with the first significant precipitation after seeding.
There is some evidence that when seedbed moisture is less than optimal, emergence is delayed but will occur in the absence of significant rainfall. This likely occurs because the seed requires more time to take up sufficient moisture to begin the germination process.
Many crops also increase the rate of growth in response to drought stress. The most probable reason is that when moisture is limited, temperatures in the crop canopy rise more than they would normally, because water transpired by the crop is reduced. This increased temperature is not reflected in standard temperature measurements made above a crop canopy.
Using and validating growth models
Most growth model information comes from published literature that have been assembled and put in a standard format. To be most confident in a particular model, it should be field-tested in your locality or a similar one.
The key to using a phenology model is to compare the models’ predicted degree day accumulation to the actual degree days using a local sampling method such as simple observation for weeds or, in the case of insects, a pheromone trap. By observing and recording the same events and comparing your records with model predictions over several years, you can fine-tune the model for your management area. In other words, informal validation of a model simply involves testing it in your region and observing how it works.
Formal validation of a model is usually done by scientists and involves:
- obtaining weather data from a given site (and preferably several other sites, some of which have unique climates or other variables);
- sampling for the particular arthropod, nematode or plant species, preferably at several stages of its development;
- combining the weather and sampling data from a minimum of three years in conjunction with statistical computer programs to compute the degree days and start dates (or biofixes).
Why determine and forecast crop stages using phenology models and the Universal Growth Staging Scale?
Probably the most effective use of phenology models is in timing of crop scouting or field checks. Having a reasonable estimate of crop stage without actually visiting the field could save considerable time and expense. In many cases, field visits can be planned several days in advance of the time when a field operation is required.
Examples are:
- accurate prediction of crop stages can determine the growth progress of cereal crops in relation to temperature and moisture;
- predicts and defines the time when herbicides or insecticides can be applied for optimum activity, efficacy and control;
- predicts and indicates the time when rust, root rot and other diseases develop. Effective correctivemeasures can sometimes be taken at certain growth stages;
- permits accurate comparisons of crop development in different years at widely separated locations.
- predicts and determines when nutrient and irrigation scheduling can correspond to crop deficiencies. Fertilizers can be added during early growth stages to correct deficiencies and increase yields;
- predicts and identifies the location of embryonic heads so assessment of potential damage to crop by grazing, hail or chemical application is possible.
TABLE 1. Phenology calculations using 0°C and 32 °F base temperatures are combined with the Universal Growth Staging Scale descriptive terms for crops grown in Montana.
| BARLEY | Data source: Perry Miller, Swift Current, SK 1996-98 | Stage | GDD°C | GDD°F |
| Emergence | Leaf tip just emerging from above-ground coleoptyle. | 1.0 | 109-145 | 228-293 |
| Leaf development | Two leaves unfolded | 1.2 | 145-184 | 293-363 |
| Tillering | First tiller visible (tillering of cereals may occur as early as stage 1.3, in this case continue with 2.1) | 2.1 | 308-360 | 586-680 |
| Stem elongation | First node detectable | 3.1 | 489-555 | 912-1031 |
| Anthesis | Flowering commences; first anthers of cereals are visible | 6.1 | 738-936 | 1360-1716 |
| Seed fill | Seed fill begins. Caryopsis of cereals watery ripe (first grains have reached half of their final size). | 7.1 | 927-1145 | 1700-2093 |
| Dough stage | Soft dough stage, grain contents soft but dry, fingernail impression does not hold. | 8.5 | 1193-1438 | 2179-2620 |
| Maturity complete | Grain is fully mature and drydown begins. Ready for harvest when dry. | 8.9 | 1269-1522 | 2316-2771 |
WHEAT (Hard Red) |
Data source: Stu Brandt, Scott, SK 1993-97 and Perry Miller, Swift Current, SK 1995-98 | Stage |
GDD°C |
GDD°F |
| Emergence | Leaf tip just emerging from above-ground coleoptyle | 1.0 | 125-160 | 257-320 |
| Leaf development | Two leaves unfolded | 1.1 | 169-208 | 336-406 |
| Tillering | First tiller visible (tillering of cereals may occur as early as stage 1.3, in this case continue with 2.1) | 2.1 | 369-421 | 696-789 |
| Stem elongation | First node detectable | 3.1 | 592-659 | 1097-1218 |
| Anthesis | Flowering commences; first anthers of cereals are visible | 6.1 | 807-901 | 1484-1653 |
| Seed fill | Seed fill begins. Caryopsis of cereals watery ripe (first grains have reached half of their final size). | 7.1 | 1068-1174 | 1954-2145 |
| Dough stage | Soft dough stage, grain contents soft but dry, fingernail impression does not hold. | 8.5 | 1434-1556 | 2613-2832 |
| Maturity complete | Grain is fully mature and drydown begins. Ready for harvest when dry. | 8.9 | 1538-1665 | 2800-3029 |
OAT |
Data source: Stu Brandt, Scott, SK 1993-97 |
Stage |
GDD°C |
GDD°F |
| Anthesis | Flowering commences; first anthers are visible | 6.1 | 760-947 | 1400-1736 |
| Seed fill | Seed fill begins. Caryopsis of cereals watery ripe (first grains have reached half of their final size). | 7.1 | 1019-1229 | 1866-2244 |
| Dough stage | Soft dough stage, grain contents soft but dry, fingernail impression does not hold. | 8.5 | 380-1625 | 2516-2957 |
| Maturity complete | Grain is fully mature and drydown begins. Ready for harvest when dry. | 8.9 | 1483-1738 | 2701-3160 |
CANARY SEED |
Data source. Perry Miller, Swift Current, SK 1995-9 |
Stage |
GDD°C |
GDD°F |
| Leaf development | First two leaves unfolded | 1.2 | 202-259 | 395-498 |
| Tillering | First tiller visible (tillering of cereals may occur as early as stage 1.3, in this case continue with 2.1) | 2.1 | 378-452 | 712-845 |
| Stem elongation | First node detectable | 3.1 | 574-667 | 1065-1232 |
| Anthesis | Flowering commences; first anthers are visible | 6.1 | 771-920 | 1419-1688 |
| Seed fill | Seed fill begins. Caryopsis of cereals watery ripe (first grains have reached half of their final size). | 7.1 | 975-1140 | 1787-2084 |
| Dough stage | Soft dough stage, grain contents soft but dry, fingernail impression does not hold. | 8.5 | 1261-1447 | 2301-3636 |
| Maturity complete | Grain is fully mature and drydown begins. Ready for harvest when dry. | 8.9 | 1342-1535 | 2447-2795 |
FLAX |
Data source. Stu Brandt, Scott, SK, 1993-97. Perry Miller, Swift Current, SK 1997-98. | Stage |
GDD°C |
GDD°F |
| Emergence | Cotyledons completely unfolded. | 1.0 | 104-154 | 219-309 |
| Leaf stages | First pair of true leaves unfolded. | 1.2 | 150-208 | 302-406 |
| Four true leaves unfolded. | 1.4 | 197-262 | 386-503 | |
| Six true leaves unfolded. | 1.6 | 243-315 | 469-599 | |
Flowering |
Flowering begins. First flowers open on at least 50% of plants. Stage flax early in morning before flower petals fall off. | 6.0 |
582-706 |
1079-1302 |
| Flowering 50% complete. | 6.5 | 758-895 | 1396-1643 | |
| Seed fill | Seed fill begins. 10% of seeds have reached final size. | 7.1 | 969-1121 | 1776-2049 |
| Maturity | Seed begins to mature. 10% of seed has changed color. | 8.1 | 1321-1499 | 2409-2730 |
Maturity complete |
90% seed color change. Seeds brown and rattle in capsules. Ready for swathing or wait until drydown complete for direct harvesting. | 8.9 |
1603-1801 |
2917-3273 |
CANOLA (B. napus) |
Data source: Stu Brandt, Scott, SK 1993-97 and Perry Miller, Swift Current, SK 1995-98 | Stage |
GDD°C |
GDD°F |
| Emergence | Cotyledons completely unfolded. | 1.0 | 152-186 | 305-366 |
| Leaf Stages | Two leaves unfolded. | 1.2 | 282-324 | 539-615 |
| Four leaves unfolded. | 1.4 | 411-463 | 771-865 | |
Flowering |
Flowering begins. At least one open floret on 50% or more plants. | 6.0 | 582-666 | 1079-1230 |
| Flowering 50% complete. | 6.5 | 759-852 | 1398-1565 | |
| Seed fill | Seed fill begins. 10% of seeds have reached final size. | 7.1 | 972-1074 | 1781-1965 |
| Maturity | Seed begins to mature. 10% of seed has changed color. | 8.1 | 1326-1445 | 2418-2633 |
| Swathing | 40% of seed on main stem has changed color. Swathing recommended at this stage. | 8.4 | 1432-1557 | 2609-2834 |
CANOLA (B. rapa) |
Data source: Stu Brandt, Scott, SK 1993-97 and Perry Miller, Swift Current, SK 1995-98 | Stage |
GDD°C |
GDD°F |
| Emergence | Cotyledons completely unfolded. | 1.0 | 102-143 | 215-289 |
| Leaf Stages | Two leaves unfolded. | 1.2 | 201-254 | 393-489 |
| Four leaves unfolded. | 1.4 | 300-365 | 572-689 | |
Flowering |
Flowering begins. At least one open floret on 50% or more plants. | 6.0 | 467-554 | 872-1029 |
| Flowering 50% complete. | 6.5 | 630-726 | 1166-1338 | |
| Seed fill | Seed fill begins. 10% of seeds have reached final size. | 7.1 | 826-934 | 1518-1713 |
| Maturity | Seed begins to mature. 10% of seed has changed color. | 8.1 | 1152-1279 | 2105-2334 |
| Swathing | 40% of seed on main stem has changed color. Swathing recommended at this stage. | 8.4 | 1249-1382 | 2280-2519 |
MUSTARD (B. juncea) |
Data source: Stu Brandt, Scott, SK 1993-97 and Perry Miller, Swift Current, SK 1995-98 | Stage |
GDD°C |
GDD°F |
| Emergence | Cotyledons completely unfolded. | 1.0 | 108-136 | 226-276 |
| Leaf Stages | Two leaves unfolded. | 1.2 | 214-251 | 417-483 |
| Four leaves unfolded. | 1.4 | 320-365 | 608-689 | |
Flowering |
Flowering begins. At least one open floret on 50% or more plants. | 6.0 | 506-567 | 942-1052 |
| Flowering 50% complete. | 6.5 | 679-747 | 1254-1376 | |
| Seed fill | Seed fill begins. 10% of seeds have reached final size. | 7.1 | 886-962 | 1626-1763 |
| Maturity | Seed begins to mature. 10% of seed has changed color. | 8.1 | 1232-1322 | 2249-2411 |
| Swathing | 70% of seed on main stem has changed color. Swathing sometimes recommended at this stage. | 8.7 | 1440-1538 | 2624-2800 |
| Maturity complete | 90% of seed changed color. Await completion of drydown if direct harvesting. | 8.9 | 1509-1610 | 2748-2930 |
MUSTARD (S. alba) |
Data source: Stu Brandt, Scott, SK 1994-97 and Perry Miller, Swift Current, SK 1995-98 | Stage |
GDD°C |
GDD°F |
| Emergence | Cotyledons completely unfolded. | 1.0 | 110-136 | 230-276 |
| Leaf Stages | Two leaves unfolded. | 1.2 | 209-243 | 408-469 |
| Four leaves unfolded. | 1.4 | 308-349 | 586-660 | |
Flowering |
Flowering begins. At least one open floret on 50% or more plants. | 6.0 | 468-529 | 874-984 |
| Flowering 50% complete. | 6.5 | 650-718 | 1202-1324 | |
| Seed fill | Seed fill begins. 10% of seeds have reached final size. | 7.1 | 868-945 | 1594-1733 |
| Maturity | Seed begins to mature. 10% of seed has changed color. | 8.1 | 1231-1322 | 2247-2411 |
| Maturity complete | 90% of seed changed color. Await completion of drydown for direct harvesting. | 8.9 | 1521-1625 | 2769-2957 |
CHICK PEA Desi |
Data source: Stu Brandt, Scott, SK 1995-97 and Perry Miller, Swift Current, SK 1995-98 | Stage |
GDD°C |
GDD°F |
Leaf Stages |
Two leaves unfolded. | 1.2 | 179-243 | 354-469 |
| Four leaves unfolded. | 1.4 | 262-337 | 503-638 | |
| Six leaves unfolded. | 1.6 | 346-431 | 654-807 | |
| Eight leaves unfolded. | 1.8 | 429-525 | 804-977 | |
Flowering |
Flowering begins. At least one open floret on 50% or more plants. | 6.0 | 645-724 | 1193-1335 |
| Flowering 50% complete. | 6.5 | 823-910 | 1513-1670 | |
| Seed fill | Seed fill begins. 10% of seeds have reached final size. | 7.1 | 1037-1133 | 1898-2071 |
| Maturity | Seed begins to mature. 10% of seed has changed color. | 8.1 | 1394-1505 | 2541-2741 |
| Maturity complete | 90% of seed changed color. Await completion of drydown for direct harvesting. | 8.9 | 1679-1803 | 3054-3277 |
LENTIL |
Data source: Stu Brandt, Scott, SK 1993-97 and Perry Miller, Swift Current, SK 1995-98 | Stage |
GDD°C |
GDD°F |
Leaf Stages |
Two leaves unfolded. | 1.2 | 161-192 | 321-377 |
| Four leaves unfolded. | 1.4 | 248-285 | 478-545 | |
| Six leaves unfolded. | 1.6 | 335-378 | 635-712 | |
| Eight leaves unfolded. | 1.8 | 423-471 | 793-879 | |
Flowering |
Flowering begins. At least one open floret on 50% or more plants. | 6.0 | 762-853 | 1403-1567 |
| Flowering 50% complete. | 6.5 | 931-1030 | 1707-1886 | |
| Seed fill | Seed fill begins. 10% of seeds have reached final size. | 7.1 | 1133-1241 | 2071-2265 |
| Maturity | Seed begins to mature. 10% of seed has changed color. | 8.1 | 1470-1594 | 2678-2901 |
| Swathing | 70% of seed changed color. Recommended stage for swathing. | 8.7 | 1673-1806 | 3043-3282 |
| Maturity complete | 90% of seed changed color. Await completion of drydown for direct harvesting. | 8.9 | 1740-1876 | 3164-3408 |
PEA |
Data source: Stu Brandt, Scott, SK 1993-97 and Perry Miller, Swift Current, SK 1995-98 | Stage |
GDD°C |
GDD°F |
Leaf Stages |
Two leaves unfolded. | 1.2 | 198-230 | 388-446 |
| Four leaves unfolded. | 1.4 | 301-340 | 573-644 | |
| Six leaves unfolded. | 1.6 | 404-449 | 759-840 | |
| Eight leaves unfolded. | 1.8 | 507-558 | 944-1036 | |
Flowering |
Flowering begins. At least one open floret on 50% or more plants. | 6.0 | 724-835 | 1335-1535 |
| Flowering 50% complete. | 6.5 | 862-982 | 1583-1799 | |
| Seed fill | Seed fill begins. 10% of seeds have reached final size. | 7.1 | 1028-1158 | 1882-2116 |
| Maturity | Seed begins to mature. 10% of seed has changed color. | 8.1 | 1305-1451 | 2381-2643 |
| Maturity complete | 90% of seed changed color. Await completion of drydown for direct harvesting. | 8.9 | 1527-1686 | 2780-3066 |
| SUNFLOWER (depends on maturity class). | Data source: Perry Miller, Swift Current, SK 1995-98 and Stu Brandt, Scott, SK 1995 and (Early maturing, | Stage |
GDD°C |
GDD°F |
| Emergence | Cotyledons completely unfolded. | 1.0 | 138-191 | 280-375 |
Leaf Stages |
Two leaves unfolded. | 1.2 | 249-313 | 480-595 |
| Four leaves unfolded. | 1.4 | 359-435 | 678-815 | |
| Six leaves unfolded. | 1.6 | 470-558 | 878-1036 | |
Flowering |
Flowering begins. At least one open disc floret on 50% or more plants. | 6.0 | 935-1077 | 1715-1970 |
| Flowering 50% complete. | 6.5 | 1081-1232 | 1977-2249 | |
| Seed fill | Seed fill begins. 10% of seeds have reached final size. | 7.1 | 1255-1417 | 2291-2582 |
| Maturity | Seed begins to mature. 10% of seed has changed color. | 8.1 | 1547-1725 | 2816-3185 |
| Maturity complete | 90% of seed changed color. Await completion of drydown for direct harvesting. | 8.9 | 1780-1972 | 3236-3581 |
How to predict a crop stage using degree days
STEP 1. Monitor for suitable soil temperature and seed into sufficient moisture to allow germination.
STEP 2. Record the seeding date and coinciding degree day value (beginning accumulation) by running the degree day accumulation report at http://uspest.org/wea/ using the correct base temperature for the crop in question.
STEP 3. When the difference between the beginning accumulation value (which may be zero) and the current accumulated value approaches the Table 1 values, watch for that corresponding crop stage to occur in the field. The descriptive terms included in Table 1 should help.
Note: Under drought stress, GDD requirements will be toward the low end of the reported range for each stage, and wet environments delay crop advancement toward the high range values reported for each stage.
STEP 4. Validate the Table 1 values for your area by recording when the crop stage actually occurs in the field (see Validate Crop Stage below). The difference between the accumulation report value for the day you determine a stage and the Table 1 values is the local correction value. Over time, making this adjustment to the table values will increase the accuracy of degree day forecasting.
Validate crop stage
To validate that the stage predicted is occurring in your crop, walk an “M” or zig zag pattern to select a plant from 10 locations in the field. Drop to one knee and immediately place your index finger on the ground. Carefully remove the plant nearest your finger. Refer to the descriptive terms listed in the table to decide if the stage you are predicting has occurred or is about to occur.
STEP 5. Repeat this process for other crop stages and pests, like wild oats.
Sources
Pulse Production Manual, Saskatchewan Pulse Growers, Saskatoon, Canada April 2000.
Lancashire, P.D., H. Bleiholder, T. van den Boom, P. Langeluddeke, R. Stauss, E. Weber and A. Witzenberger. 1991. A uniform decimal code for growth stages of crops and weeds. Ann. Appl. Biol. 119:561-601.
The Montana Small Grain Guide, Cooperative Extension Service Agricultural Experiment Station, Montana State University, Bozeman Bulletin 364, August 1985.
Consult Baskerville & Emin (1969), Andrewartha & Birch (1973), Allen (1976), Zalom et al. (1983), and Wilson & Barnett (1983) if you are interested in the historical development of the degree-day concept.