

Secondary Macronutrients: Cycling, Testing and Fertilizer Recommendations
This module is the sixth in a series of Extension materials designed to provide Extension agents, Certified Crop Advisers (CCAs), consultants, and producers with pertinent information on nutrient management issues. To make the learning ‘active’, and to possibly provide credits to Certified Crop Advisers, a quiz accompanies this module. In addition, realizing that there are many other good information sources including previously developed Extension materials, books, web sites, and professionals in the field, we have provided a list of additional resources and contacts for those wanting more in-depth information about sulfur, calcium, and magnesium.
Last Updated: 06/05by Nathan Korb, Clain Jones, and Jeff Jacobsen
Objectives
After reading this module, the reader should:
- Understand the major processes that determine the availability of the secondary nutrients, sulfur, calcium, and magnesium, in the soil
- Know the factors that affect each of these nutrient cycling processes
- Recognize how different crops and cropping systems affect nutrient availability
- Understand how to calculate S fertilizer requirements
Background
Sulfur (S), calcium (Ca), and magnesium (Mg) are considered secondary macronutrients because they are less commonly yield-limiting than the primary macronutrients (N, P, and K), yet are required by crops in relatively large amounts. Although most soils in Montana and Wyoming contain adequate secondary nutrients for crop production, S deficiencies are on the rise both in the region and throughout the world (Rasmussen and Kresge, 1986).Three global trends are responsible for increasing S deficiencies:
- the shift in modern fertilizers to more concentrated, higher-analysis forms containing little to no S (a historical by- product of the manufacturing process);
- the reduction of sulfur dioxide emissions from burning coal and oil, which decreases atmospheric S additions; and
- the steady increase in crop S uptake and removal due to high-yielding varieties and more productive management.
Effective management of secondary nutrients requires an understanding of the processes that determine their availability to crops and the methods to manage soils with inadequate secondary nutrient levels. Because S is a greater concern for most producers in Montana and Wyoming than Ca and Mg, it will be discussed first and in greater detail in this module.
Figure 1. Sulfur Cycle.
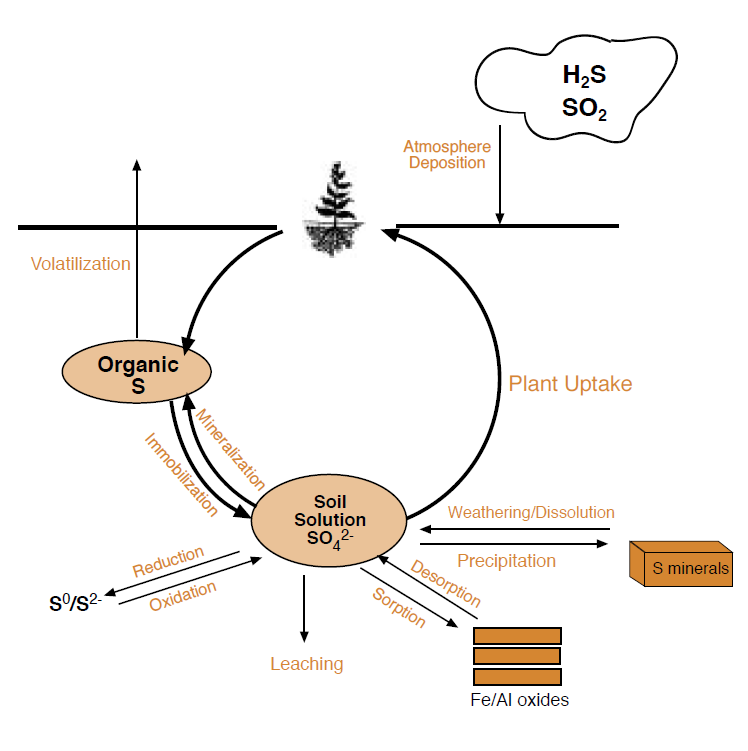
Table 1. Description of each S form.
| Sulfur Form | Molecular Formula | Notes |
| Sulfate | SO4-2 | Plant available form, anion found in solution and weakly sorbed to soil |
| Sulfides | S-2 | Reduced S, common in saturated soils |
| Elemental S | S0 | Uncommon in significant amounts, oxidizes to plant available S |
| Mineral S | CaSO4, FeS2 | Can be a source or sink (loss) of S in soil |
| Organic S | Organic S | Typically the largest S reserve, slowly supplies S to soil solution |
| Atmospheric S | SO2, H2S, —COS | Oxidized to sulfate in soil and plants |
| Volatile S | Organic S | Microbial volatilization releases S from soil |
Sulfur Cycling
Sulfur undergoes numerous transformations in the soil, involving biological, chemical, and atmospheric processes, similar to the nitrogen cycle (NM Module 3, Nitrogen Cycling, Testing and Fertilizer Recommendations). The major forms of S are listed in Table 1. Only a small fraction of the total S in the soil is readily available to crops. The major processes governing S availability in the soil are plant uptake, mineralization, immobilization, exchange, volatilization, precipitation, oxidation, reduction, mineral weathering, and leaching (Figure 1). Soil properties such as water content, pH, temperature, and aeration influence these processes and consequently affect the amount of S available to satisfy crop requirements. Management of S is improved by an understanding of how this nutrient cycles in the soil and under what conditions deficiencies are likely to occur.
S Plant Uptake
Plants require significant S, usually amounts comparable to P, but less than N or K (Havlin et al. 1999). Most crops absorb between 10-100 lb S/ac from the soil in the form of sulfate (SO4-2), although only 10-40 lb S/ac are removed from the system with harvest (Table 2). Sulfate is an anion and exists primarily in soil solution because the negative charge of the soil offers few positively charged sorption sites for S to occupy. Crops can uptake adequate amounts of S in soils with soluble SO4-2 concentrations above the critical level of 5 – 10 ppm in the top six inches of soil via mass flow (see NM Module 2, Plant Nutrition and Soil Fertility). Soluble S usually represents less than 10%of total S in the soil and is replenished by mineralization of organic matter, weathering of mineral S, oxidation of reduced S, and desorption.
Q&A #1
How do modern, high-analysis fertilizers affect S inputs?
For a time, many N,P, and K fertilizers included Sas a manufacturing by- product. The result was that some S was added to the soil every year with N, P, and K. Since then, higher analysis N and other fertilizers have evolved which are more refined and contain little to no S, such as urea and ammonium nitrate.
Table 2. S removal amounts in harvested portions of selected agricultural crops.
| Crop | Assumed Yield Per Acre | S Removal (lb/ac) |
| Alfalfa | 2.5 t | 13 |
| Barley | 50 bu | 10 |
| Brome | 1.5 t | 6 |
| Canola | 2t | 8 |
| Corn silage | 20 t | 19 |
| Oats | 60 bu | 12 |
| Orchard grass | 1.5 t | 9 |
| Potatoes | 300 cwt. | 14 |
| Sugar Beets | 25 t | 38 |
| Timothy | 1.5 t | 6 |
| Wheat | 40 bu | 10 |
From Jones, 1998.
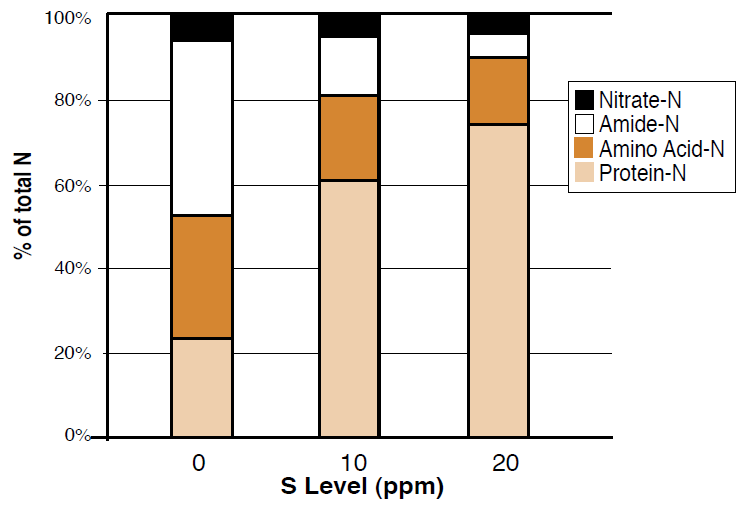
Figure 2. Effect of varying levels of S on the distribution of N in tops of wheat plants (Modified from Steward and Porter, 1969).
Q&A #2
What is ‘efficient use of N’ in a plant?
Plants require N and S as ‘building blocks’ for amino acids and proteins. If S is in short supply, protein synthesis slows and N cannotbe used, even if it is in abundant supply. The N then accumulates in the plant in ‘building block’ forms (nitrates, amides, etc.) and plant needs are not satisfied. In cropping systems where N additions seem to have little effect, S may be inhibiting N utilization and therefore S fertilization can release crop potential.
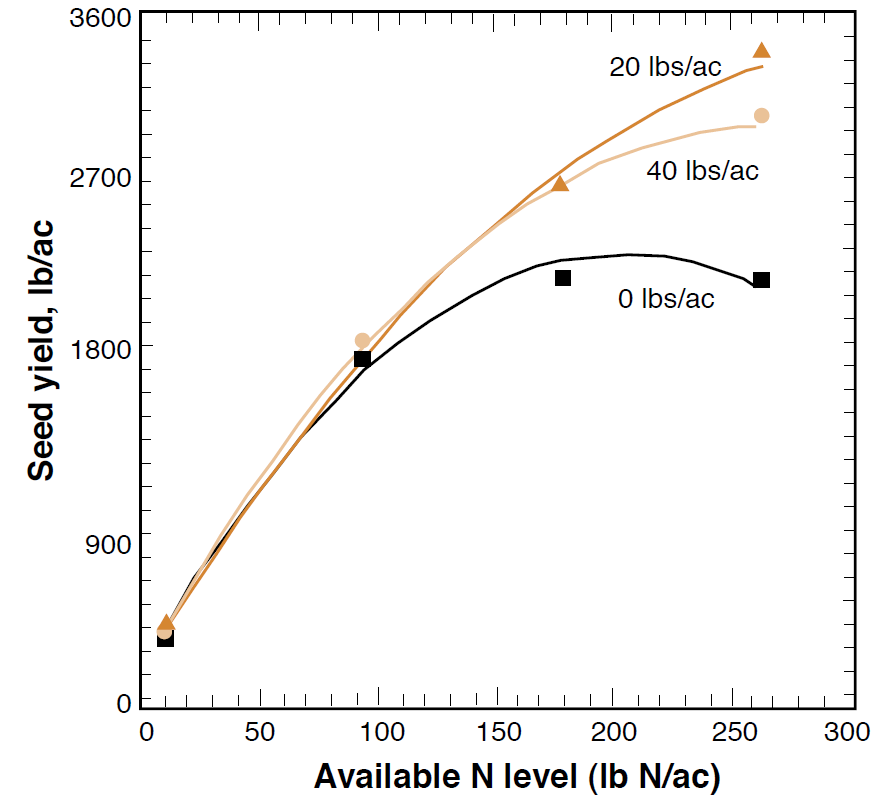
Plants require S as a constituent of three amino acids which are essential to protein synthesis and represent approximately 90% of the S content in plants. S is also necessary in the formation of chlorophyll, vitamins, enzymes, and aromatic oils, which give crops such as mustards their flavor and odor. Efficient N utilization requires adequate S because both are needed to form proteins in the plant. Insufficient S inhibits protein synthesis, causing N to accumulate in the plant as nitrate, amides, and amino acids rather than protein (Figure 2). A plant N:S ratio of about 15:1 is ideal for effective protein synthesis. Ratios higher than this suggest that protein synthesis is being limited by lack of S, while smaller ratios imply surplus S, which is retained as soluble S within the plant (Stewart and Porter, 1969). In this way, N and S interactions are positively related and should be managed together. No response to S additions will occur if N is limiting plant growth. Similarly, an optimal S level maximizes the effect of N fertilization on yield (Figure 3), although actual N uptake in the plant does not change (Rasmussen et al., 1975).
Research has shown that S plays an important role in crop qualities such as the bread making quality of wheat and the protein content of forages and grains. Breadmaking varieties of wheat have approximately 10% more S in grain than non-breadmaking varieties, although total plant S uptake is similar (Rendig, 1986). Two important factors related to breadmaking are loaf volume and dough extensibility. Both of these factors are directly related to S concentration in grain, which in turn is dependent upon available S in the soil (Unger et al., 2002). As a constituent of amino acids, sufficient S is essential for high protein content in forages and grains.
Sulfur dioxide (SO2) and hydrogen sulfide (H2S) from the atmosphere can also represent significant sources of S for plants in locations down-wind from coal-burning plants, metal smelters, geo-thermal areas, and urban areas. These compounds are beneficial only in low concentrations and are absorbed by plant leaves through stomata. Atmospheric additions to crops and soils range significantly, but are usually between 3 to 11 lb S/ac (Foth and Ellis, 1997).
Figure 3. Increased effect of N fertilizer with S additions in dryland canola seed yield (Modified from Jackson, 2000).
Crop residues contain considerable amounts of S because this nutrient is incorporated into the plant material and is not easily released. As is the case with other nutrients, the plant material removed at harvest can represent a significant loss of S from the soil. Inforage crops, such as alfalfa with its high S uptake, most of the biomass is removed,resulting in a major loss of S. On the other hand, in canola, only about 15% of the total plant S is removed with the harvested seeds, so most of the S remains in the residue (Jackson, 2000). Grazing forages onsite can significantly reduce S losses because livestock release most S back to the soil. In fact, as much as 90% of S consumed by sheep is released back to the soil (Tisdale et al., 1986).
Mineralization and Immobilization
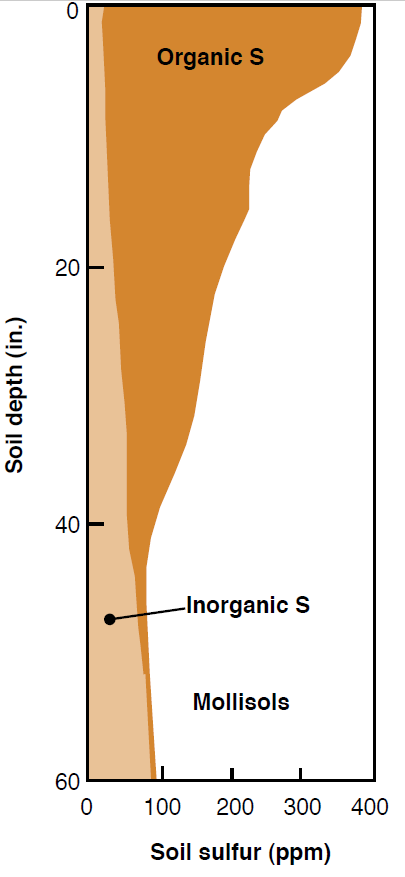
Organic S compounds held in plant, animal, and microbial residues collect in the soil organic matter (OM) and represent the largest S pool in well-developed grassland soils (mollisols), which predominate much of Montana’s and Wyoming’s cultivated agriculturallands (Figure 4). Over 90% of the total soil S in this region exists in the organic form (Havlin et al., 1999), except in soils where mineral S accumulations of gypsum are significant. Microorganisms decompose the OM and release plant available S through the process of mineralization, which occurs similarly in N cycling (see NM Module 3). About 1 to 3% of organic S is mineralized each year, contributing 4-13 lb/ac of soluble S (SO4-2) for plant use annually. The amount of S made available to plants annually via mineralization depends on the amount of OM in the soil and the concentration of S in OM; therefore, taking steps to maintain or increase soil OM (with no-till, minimum till, or organic additions) can help supply a relatively constant amount of available S to the soil.
Immobilization refers to the process of converting inorganic S (SO4-2) to organic S, and is essentially the reverse of mineralization. Microorganisms remove available S from solution and convert it into proteins and other organic compounds. Although this process removes S from the available pool, the S is still in a reserve pool that could eventually become available to plants via mineralization.
Since mineralization and immobilization are primarily biological processes, any factors affecting microbial growth will influence both of these S transformations. Important factors include soil temperature, water content, pH, C:S ratio, aeration, and residue composition. The highest mineralization and immobilization rates will occur under aerated, warm, and moist conditions with near neutral pH levels because these conditions are optimal for microbial activity.
Figure 4. Typical distribution of organic and inorganic S in a mollisol (Brady, 1999).
The N:S ratio is relatively stable in OM, remaining near 8:1 (Foth and Ellis, 1997), but the C:S ratio is more varied, and strongly affects the relative amounts of mineralization and immobilization. If residues and organic matter lack sufficient amounts of S, microbes will pull the needed S from the soil, and immobilize it in organics, as is the case when a residue like sawdust is added to soil. Residues with C:S ratios higher than about 400:1 result in net immobilization of S from the soil, while C:S ratios lower than 200:1 result in net mineralization of S into the soil (Freney, 1986). Between ratios of 200:1 and 400:1, a combination of the two processes occurs. The C:S ratios of a number of organic residues are listed in Table 3. Each progressive decomposition cycle of soil residues results in C expelled as carbon dioxide, thereby lowering the C:S ratio. In this way, even residues with high C:S ratios can eventually supply the soil with available S.
Sorption, Precipitation, and Weathering
Inorganic S occurs in solid phases in the soil as sorbed S or S minerals. Sorption of SO4-2 increases as anion exchange capacity (AEC) of the soil increases (see NMModule 2). Soils dominated by positively charged Fe/Al oxide clays will have a high AEC and therefore sorb significant sulfate. In this region, soils typically have low AEC because of their strong net negative charge and high pH levels, so sorption of sulfate is minimal. As a general rule, SO4-2 sorption is insignificant above pH 6.5.
Inorganic S minerals, such as gypsum (CaSO4), represent an important S ‘pool’ in Montana and Wyoming soils. Commonly, gypsum accumulates in the subsoil, forming a S-rich layer often in close proximity to calcium carbonate (CaCO3) layers. Although the surface layers of these soils may have low levels of plant available S, the deeper mineral S maintains an adequate supply of S within the rooting depth of most crops (Beaton and Soper, 1986). Early in the growing season, subsoil S may not be available to crops because it is out of reach of the growing roots. Later in the growing season, when soil water is usually moving upward through the profile and plant roots have grown deeper, adequate S is generally accessible to crops.
Table 3. C:S ratio of various residues.
| Organic Material | C:S Ratio |
| Municipal wastewater | 20:1 |
| Soil organic matter | ~100:1 |
| Horse manure | 494:1 |
| Poultry manure | 518:1 |
| Cow manure | 719:1 |
| Corn stalk | 2029:1 |
| Sawdust | 11011:1 |
From Tabatabai and Chae, 1991
S occurs in numerous primary and secondary minerals, which release either sulfate or sulfide (S-2) as they weather. Gypsum is widely distributed in arid and semi-arid soils where precipitation is too low to leach the mineral out of the profile. Shales and claystones in the region contain gypsum and release plant available S as they weather (Veseth and Montagne, 1980). Ore deposits in Montana and Wyoming often contain metal sulfides, such as iron, zinc, and manganese sulfides. As the sulfides (S-2) are exposed to oxygen and water they oxidize to sulfates and can significantly lower the pH of the surrounding soil or water, as is the case with acid mine tailings. In agricultural settings, the slow release of sulfide minerals into the soil can be beneficial, but excess acidity may be a concern. Elemental S (S0) also oxidizes to sulfate in the presence of water and air and is commonly applied to high pH soils both as an S fertilizer and as a means of lowering the pH for plant growth. The resulting acidity is generally short lived in well-buffered soils and requires continued application to be maintained. Gypsum added to soil as fertilizer will neither raise nor lower the pH of the soil because the S is already completely oxidized in the form of sulfate. Sulfides and elemental sulfur are found in waterlogged soils and wetlands, and generally exist in low concentrations in most agricultural soils.
S Losses
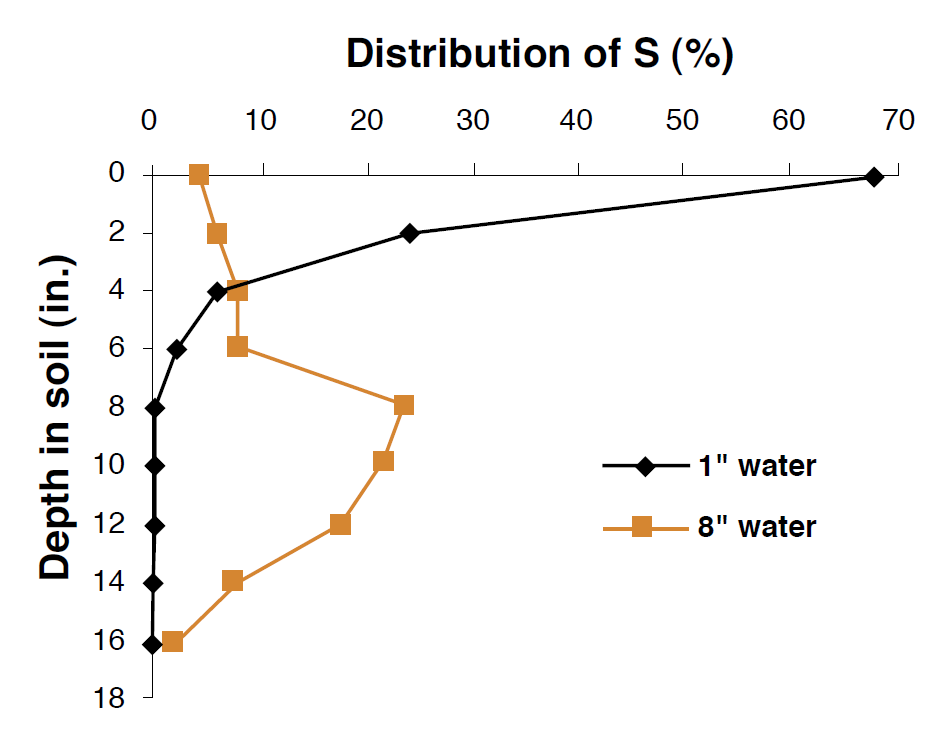
S is lost from the soil by two processes other than crop uptake: leaching and volatilization. Leaching is the physical removal of plant available S by water moving through the profile, whereas volatilization represents a biological or chemical transformation and subsequent release of S into the atmosphere. The areas with the highest risk for sulfate leaching are associated with high precipitation, irrigated conditions, coarse textured, shallow soils, and soils with low AEC. Irrigation following SO4-2 fertilizer application can move SO4-2 through a profile and eventually out of reach of plant roots (Figure 5). Sulfate leaching represents an economic loss, because once the SO4-2 has left the soil system, it is no longer available for crop uptake. In semi-arid climates, sulfate often collects in the subsoil, as described earlier, because there is insufficient water to flush the anion below the rooting zone of plants. Leaching losses are generally less in high pH soils because sulfate will precipitate with Ca or Mg. It should be noted that in some soils, water moving upward through the soil profile via capillary action late in the growing season can carry S towards the plant roots and the soil surface. In such instances, excess Ca and Mg sulfate salts can accumulate to harmful levels in the surface and limit plant growth. Careful water management, especially in irrigated cropping systems can prevent many of the problems associated with leaching of S or the over-accumulation of S salts.
Figure 5. Distribution of S added to the soil surface as a function of irrigation amounts (Modified from Havlin et al., 1999).
Volatilization of sulfur compounds represents a relatively small loss in most agricultural soils. Generally, the amount of S volatilized from the soil is less than 0.05% of total S in the soil, and from live plants the release is between 0.03% and 6% of total S in the plant (Havlin et al., 1999). Most volatilization in the soil occurs during biological decomposition of organic residues. Biological volatilization can occur under both aerobic and anaerobic conditions, but is less significant in well-drained, well-aerated soils (Tisdale et al., 1986).
Table 4. Sufficiency range for selected crops.
| Crop | %S | Plant N:S |
| Alfalfa | 0.25-0.50 | 12:1 |
| Barley | 0.15-0.40 | 16:1 |
| Canola | 0.50-0.90 | 11:1 |
| Corn | 0.25-0.80 | 12:1 |
| Grass | 0.17-0.30 | 14:1 |
| Wheat | 0.15-0.40 | 16:1 |
Jones, 1998; Grant and Bailey, 1993; Beaton and Soper, 1986.
Probably the most significant volatile loss of S occurs when agricultural areas are subject to fire. Although sulfate concentrations may increase due to chemical mineralization (burning) of organic S, burning dry grass has resulted in losses of 75% of total S in vegetative cover (Tisdale et al., 1986). The conversion of organic S to inorganic S by burning may also make the nutrient more susceptible to leaching.
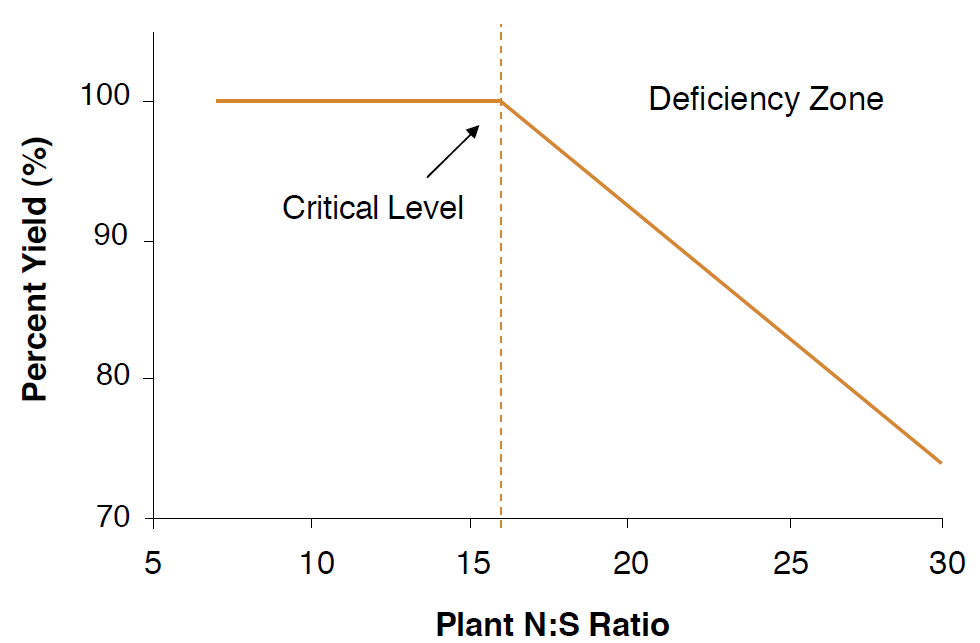
Figure 6. Relationship between relative yield of wheat and plant N:S ratio (modified from Spencer and Freney, 1980).
Sampling for S
Sampling soil, plant, or irrigation water for S can be useful in determining S fertilizer needs. Each of these is discussed below.
The primary goal of soil testing for S is to determine S fertilizer requirements for a specific crop. The mechanics of soil testing and sampling have been previously described (NM Module 1, Soil Sampling and Laboratory Selection). Sampling for S has been a subject of debate because the standard soil test for extractable SO4-S has proven somewhat unreliable in predicting yield responses in Montana and Wyoming (Gavlak, 1982; Jackson, 2000). Although a high test level (SO4-S >5-10 ppm) in the top 6 inches of soil will nearly guarantee adequate S, soils with low and moderate S test levels do not always respond to S additions. A low testing soil may still supply a crop with adequate S because of ample S below the testing depth (i.e., a gypsum layer), significant organic S mineralized during the growing season, or high S levels in shallow groundwater especially for deep-rooting crops such as alfalfa. Other soil tests for S include measuring the organic S content to estimate mineralization during the growing season and measuring the soil N:S ratio. Soil S tests help determine potentially deficient soils, but plant tissue tests have proven more effective in identifying actual S deficiencies (Spencer and Freney, 1980).
Plant tissue testing is used to measure the amount of nutrients in the plant. Tissue tests can analyze the total percent S in dry matter or the plant N:S. Total %S levels in crops and plant parts vary below. and sufficient ranges are listed in Table 4. Results below these sufficient ranges suggest deficiency and the need for S additions. The plant N:S ratio is commonly used as an indicator of S status in crops (Table 3). For example, the critical ratio for wheat is about 16:1, so, assuming adequate nitrogen levels in the soil, ratios greater than 16:1 represent an S deficiency in the plant (Figure 6). Tissue tests require additional laboratory procedures beyond the standard soil tests, but they are useful if S deficiency is a likely concern. Unfortunately, deficiencies indicated by tissue tests taken during the growing season cannot easily be corrected until the following year. By plotting annual soil or tissue test levels, S fertilization amounts, and crop yield, one can begin to determine how S fertilization amounts affect yield and soil test levels for a particular field.This may prove more fruitful than using published guidelines, because it is specific to your region, crop variety, and management practices.
Calculation Box 1
Calculation: S supplied by irrigation (lb/ac) = Irrigation depth (ft.) x SO4-S (ppm) x 2.7
(The 2.7 factor is because there are 2.7 million pounds in 1 acre-ft of water)
Example: The irrigation water contains 16 ppm SO4-S. One foot of irrigation water is applied per year (i.e. 1 acre-ft/acre).
How much S is supplied to the crop?
S supplied = 1 x 16 x 2.7 = 43 lb/ac
Collecting irrigation water for analysis of SO4-S is useful for adjusting S fertilizer requirements. For example, the Missouri River near Toston contains approximately 16 ppm SO4-S. Applying 1 foot of this water to a field will supply 43lb S/ac (Calculation Box 1), which should meet any crop’s S needs based on Table 2. This calculation is based on a high SO4-S concentration; rarely will the entire crop S needs be met from irrigation water alone.
S Fertilizer Recommendations
Although S has not historically been a nutrient of concern in most cropping systems in Montana and Wyoming, there are increasing reports and research results indicating significant responses to S fertilizer additions for crop yield and quality. Responses to S occur most commonly in crops with high S requirements such as alfalfa and canola, with crops where most of the plant material is removed, in sandy soils, and in soils with less than 5-10 ppm SO4-S in the top six inches. S increases yield when N levels are adequate, and the two nutrients are closely related in fertilizer response. Unlike N-P-K, accepted fertilizer guidelines for S do not exist in Montana and Wyoming. Fertilizer recommendations for crops in this region can be determined based on past responses, soil and tissue tests, and crop uptake.
Q&A #3
How does irrigation affect S management?
Irrigation water often contains considerable dissolved S, and, therefore, represents a regular addition to some soils. In some systems, irrigation water alone is sufficient in maintaining soil S levels. Irrigation water can be tested for sulfate to estimate S additions. Conversely, irrigation can significantly accelerate leaching in the soil and remove plant available S. Maintaining soil water at field capacity and avoiding over-irrigation can reduce S loss.
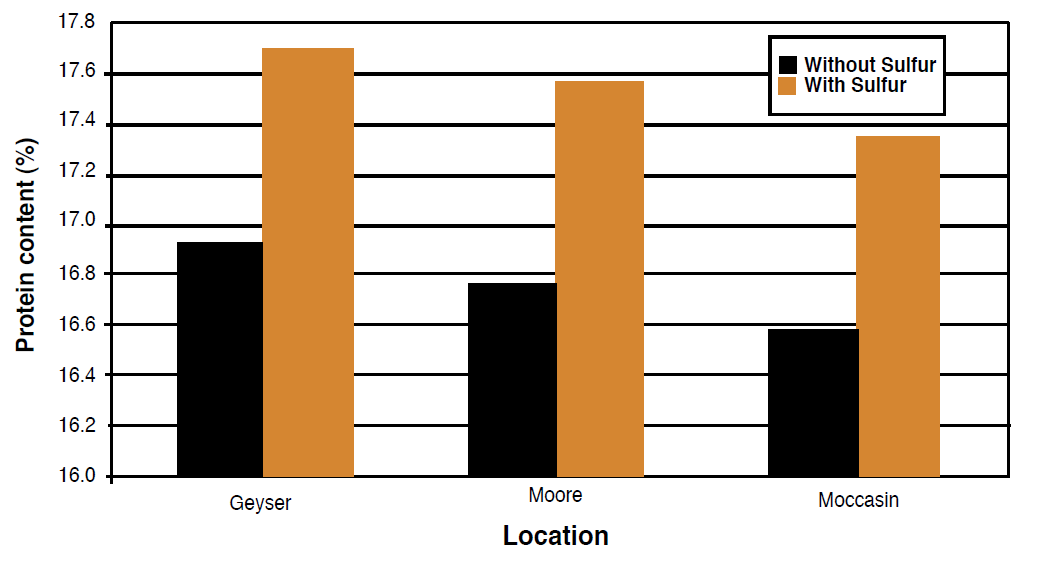
Because forages contain high amounts of S and the plant material is removed from the field, the ability of the soil to maintain adequate S is decreased and S additions are often profitable. In one study on dryland perennial forages in Montana, additions of 25 lb S/ac increased yield in one of three sites and significantly increased the protein content at all three sites (Figure 7). These sites all had soil SO4-S test levels between 3 and 4 ppm, which suggests borderline S deficiency. In a different study, orchardgrass forage yields increased 235% on irrigated alluvial soils in southwestern Montana with additions of 26 lb S/ac (Rasmussen and Kresge, 1986). In Alberta, forage crop yield increased 25% to 200% following additions of 18 lb S/ac (Beaton and Soper, 1986). For most soils in Montana and Wyoming, additions of 20 lb S/ac for alfalfa-grass forage crops are recommended if SO4-S soil test levels are less than 5 ppm in the top 6 inches (Rasmussen and Kresge, 1986). In extremely deficient, non-irrigated soils, rates as high as 50 lb S/ac are necessary to satisfy crop requirements.
Figure 7. Protein content response to fertilizer in dryland perennial forages (modified from Wichman, 2001).
Canola requires high amounts of S, but because less S is removed in the harvested portion than in forage crops, canola generally requires smaller yearly additions. Soils with less than 5 ppm SO4-S should be fertilized with 15 lb S/ac with an optimal N-P-K blend (Beaton and Soper, 1986; Jackson, 2000). Adding S to meet crop needs increases both the seed yield and the oil in the seed for canola (Beaton and Soper, 1986). Carefully maintaining the available S pool in canola operations is important to preventing yield reductions because this crop can be severely affected by S deficiency. Raising available S in Alberta soils showed increases from 28% to over 600% for canola (Beaton and Soper, 1986).
Wheat and other small grains use relatively less S and may be better suited for S deficient soils. Despite their low S requirements, wheat, barley, and oat crops have responded significantly to S additions in certain locations in Montana and Alberta with yield increases ranging from 10 to 40% (Rasmussen and Kresge, 1986). The critical soil test level for wheat is only 3 ppm SO4-S and fertilizer recommendations for deficient areas range between 10 and 15 lb S/ac.
There are numerous forms of S fertilizers available to producers, many with very different rates of release. The most common S fertilizers used in Montana and Wyoming are listed in Table 5. The major factors in choosing an S fertilizer are the S content of the fertilizer, the availability of the fertilizer to crops, the acidifying effect of the material, and the cost. Ammonium sulfate, ammonium phosphate sulfate, gypsum, and epsom salt are the most commonly used S sources because they quickly release sulfate for plant use. Of these fertilizers, ammonium sulfate contains the greatest percent S by weight (24%).
Elemental S (S0), on the other hand, must be oxidized to sulfate before plants can utilize it. The rate of this process depends on particle size, incorporation, and the soil conditions discussed earlier, and can be very slow. Dispersible, granular elemental S fertilizers are broadcast to increase surface area and exposure of S, and thereby accelerate oxidation. Even with improved distribution of S, this form of S must be applied well before the growing season if it is expected to supply the crop with S; otherwise some readily available S should be included. The other significant factor in applying S0 is the acidifying affect it may have on the soil. Most soils in Montana and Wyoming are strongly buffered at high pH levels and should not be adversely affected by this effect, but sandy soils may be more susceptible to acidification with continued S0 applications. Using elemental S generally requires more planning than other S fertilizers due to its slow availability, but an advantage of this source is its high analysis for S (90-100%).
Table 5. Commonly used forms of S fertilizers.
| Fertilizer Source | Formula | Analysis |
| Ammonium sulfate | (NH4)2SO4 | 21-0-0-24 |
| Ammonium phosphate sulfate | NH4H2PO4 • (NH4)2SO4 | 16-20-0-14 |
| Ammonium thiosulfate (ATS) | (NH4)2S2O3 | 12-0-0-26 |
| Gypsum | CaSO4 | 0-0-0-19 |
| Epsom salt | MgSO4 | 0-0-0-13 |
| Elemental S | S0 | 0-0-0-100 |
| Dispersible, granular S0 | S0 + bentonite | 0-0-0-90 |
Calculation Box 2
Calculation: S fertilizer to apply = S Recommendation/S fraction in fertilizer
Example: The fertilizer recommendation is 20 lb S /ac.How much ammonium sulfate (21-0-0-24) is needed?Recall that the 24 means that 24% of this fertilizer by weight is S. Expressed as a fraction, 24% = 0.24.
Amount of (NH4)2SO4 needed = (20 lb S /ac)/0.24 = 83 lb/acre ammonium sulfateFor comparison, how much dispersible, granular S0 would be needed?If 83 lb/ac of ammonium sulfate were applied, how much N is being added to the soil?83 lb/ac (.21) = 17 lb N /ac, which could be subtracted from the total N recommendation.
Calcium and Magnesium Cycling
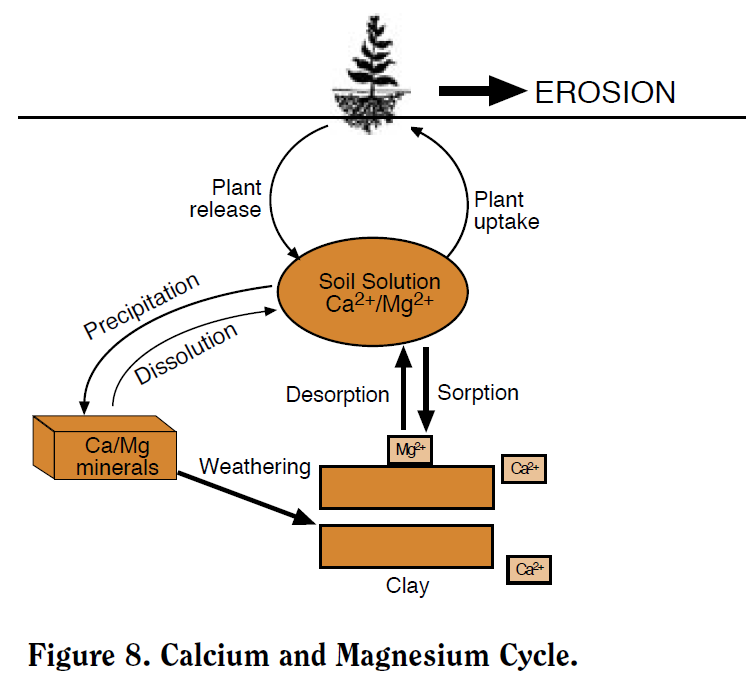
Ca and Mg occur in the soil as soluble ‘divalent’ (‘double-charged’) cations (Ca+2 and Mg+2), on cation exchange sites, and in mineral forms. The major processes in the Ca/Mg cycle are plant uptake, exchange, precipitation, weathering, and leaching (Figure 8). Ca/Mg dynamics in the soil are quite similar to K (NM Module 5). Like K, plants absorb the soluble ionic form from soil solution, which is then replenished by exchangeable and mineral Ca/Mg. The most notable difference between these nutrient cycles is the absence of Ca/Mg clay fixation.
Figure 8. Calcium and Magnesium Cycle.
Calcium
Ca plays an important role in cell elongation and maintaining membrane structure in plants. The presence of Ca in roots also regulates plant cation uptake by limiting excessive sodium (Na) and increasing beneficial K absorption. Most soils, especially those in Montana and Wyoming, contain abundant Ca in solution (30-300 ppm) relative to most crop requirements (~15 ppm). The supply of Ca in soil solution can be ten times larger than K and plants require much less Ca, so deficiencies are rare. Mass flow supplies adequate Ca to plant roots, except in low Ca soils, where diffusion becomes an important process.
Ca is usually the dominant base cation in exchange reactions, accounting for more than 70% of base saturation. Base saturation represents the percentage of the CEC occupied by base cations (Ca, Mg, K, and Na) and generally increases with pH. Exchangeable Ca exists in equilibrium with the soil solution, replenishing soluble Ca losses by plant uptake or leaching. Leaching can be significant in coarse-textured, acidic soils where substantial water moves through the profile. In many Montana and Wyoming calcareous soils, some Ca leaches out of the more acidic, organic-rich topsoil and precipitates in a Ca-rich ‘calcic’ horizon in the sub-soil in the form of calcium carbonate (CaCO3) or gypsum (CaSO4). In addition to the dissolution of these secondary deposits, Ca is also released through the weathering of primary minerals such as feldspars, micas, and limestone; all of which are common throughout this region.
Low Ca content in soil often causes acidity problems before actual Ca nutrient deficiency becomes an issue. Both the role of Ca as a base cation and its frequent occurrence with carbonates (CO3-2) and bicarbonates (HCO3-) buffer soil at high pH levels. Where acidity is a problem, liming soils with CaCO3, CaO, or Ca(OH)2 is a common practice. The role of pH in nutrient cycling and how it can be managed will be discussed in depth in a later NM Module.
Because of its strong divalent charge, Ca acts as an ionic ‘glue’, attracting clay particles and promoting aggregation through a process called ‘flocculation’. Soils with high levels of sodium (Na), referred to as ‘sodic’ soils, promote ‘dispersion’ which is the opposite of flocculation. When monovalent (‘single-charged’) Na ions dominate the clay surfaces in the soil, the weak positive charge of the ion is not strong enough to overcome the negative charges of clay particles, which then repel each other. The result of dispersion is a structureless, gel-like soil with insufficient aeration, permeability, and water-holding capacity for optimum plant growth. Additions of Ca in the form of gypsum are frequently prescribed for reclaiming sodic soils because it counters the effects of Na and promotes the aggregation critical for soil productivity. Gypsum is preferable to CaCO3 because gypsum is more soluble. Low Na irrigation water or rainwater can then be used to leach Na out of the soil profile.
Magnesium
Mg plays a critical role in nearly all parts of plant metabolism and protein synthesis, and is an essential constituent of chlorophyll. Plants require less Mg than Ca, but deficiencies are more common because less Mg exists in the soil solution. Mineral forms of Mg are relatively resistant to weathering and represent a large fraction of total soil Mg. Mineral forms of Mg include biotite, horneblende, olivene, dolomite, and most 2:1 clay minerals. Soluble Mg can also precipitate out of solution as MgCO3 or MgSO4, frequently along with CaCO3 in the sub-surface.
Although Ca and Mg share the same exchange processes, Mg sorbs less strongly to soil colloids and therefore is more prone to leaching, particularly in sandy soils. As a cation, Mg competes with Ca+2, K+, and NH4+ for plant absorption and cation exchange sites. Mg deficiencies occur when these other cations dominate soils with low Mg concentrations (<10% of base saturation). A common Mg deficiency problem in cattle is ‘grass tetany’, or ‘hypomagnesaemia’, due to insufficient Mg in forage. Livestock can be fed Mg salts in low Mg areas or soils can be amended with epsom salt (MgSO4) or dolomite (MgCO3) additions. Because of the low solubility of dolomite at pH levels above 7, spraying dissolved or dry epsom salt is most suitable on Montana’s and Wyoming’s high pH soils.
Summary
Secondary nutrients are no less essential to plant growth than the primary nutrients: N, P, and K. The mineralogy of Montana and Wyoming soils generally maintain high levels of available Ca and Mg. Because plants require relatively small amounts of these nutrients and leaching is minor, Ca and Mg deficiencies are rare in this region; accumulation of Ca and Mg salts are actually a more common problem. Although deficiencies of S are also relatively infrequent, sustained cropping with few if any inputs may cause yields to be limited by S. Sulfur plays a major role in both yield and quality for most crops and considerably improves the effectiveness of N, P, and K fertilization. Effective management for S includes fertilization and leaving maximum amounts of post-harvest residues on site, ensuring the best use of this limited nutrient ‘pool’. Significant yield and protein responses to S fertilizers have been documented throughout the region for a variety of crops. Soil and tissue testing are useful in diagnosing nutrient deficiencies and managing for them before significant yield losses occur. Understanding the cycling of secondary nutrients in the soil can also help producers predict where deficiencies are most likely to occur.
References
Beaton, J.D. and R.J. Soper. 1986. Plant Response to Sulfur in Western Canada. p. 375-403. In M.A. Tabatabai, (ed.) Sulfur in Agriculture. Agron. Monogr. 27. ASA, CSSA, and SSSA. Madison, WI.
Brady, N.C. 1984. The Nature and Properties of Soils. 9th Edition. Macmillan Publishing Company New York. 750p.
Foth, H.D. and B.G. Ellis. 1997. Soil Fertility. CRC Press, Boca Raton, Florida. 290 p.
Freney, z.R. 1986. Forms and reactions of organic sulfur compounds in soils. p. 207-232. In M.A. Tabatabai, (ed.) Sulfur in Agriculture. Agron. Monogr. 27. ASA, CSSA, and SSSA. Madison, WI.
Gavlak, R.G. 1982. Effect of nitrogen and sulfur fertilization on forages in the Gallatin Valley of Montana. M.S. Thesis. Dept. of Plant and Soil Science. Montana State University, Bozeman, MT.
Grant C.A. and L.D. Bailey. 1993. Fertility management in canola production. Can. J. Plant Sci. 73:651-670
Havlin, J.L., J.D. Beaton, S.L. Tisdale, and W.L. Nelson. 1999. Soil Fertility and Fertilizers. 6th Edition. Prentice Hall. Upper Saddle River, NJ. 499 p.
Jackson, G.D. 2000. Effects of nitrogen and sulfur on canola yield and nutrient uptake. Agron. J. 92:644-649.
Jones, J.B. 1998. Plant Nutrition Manual. CRC Press. Boca Raton, Florida. 149p.
Rasmussen, P.E. and P.O. Kresge. 1986. Plant Response to Sulfur in the Western United States. p.357-374. In M.A. Tabatabai, (ed.) Sulfur in Agriculture. Agron. Monogr. 27. ASA, CSSA, and SSSA. Madison, WI.
Rasmussen, P.E., R.E. Ramig, R.R. Allmaras, and C.M. Smith. 1975. Nitrogen-sulfur relations in soft white winter wheat. Agron. J. 67:224-229.
Rendig, V.V. 1986. Sulfur and crop quality. p. 635-650. In M.A. Tabatabai, (ed.) Sulfur in Agriculture. Agron. Monogr. 27. ASA, CSSA, and SSSA. Madison, WI.
Spencer, K. and J.R. Freney. Assessing the sulfur status of field-grown wheat by plant analysis. Agron. J. 72:469-472.
Tabatabai, M.A. and Y.M. Chae. 1991. Mineralization of sulfur in soils amended with organic wastes. J. Environ. Qual. 20:684-690.
Tisdale, S.L., R.B. Reneau, and J.S. Platou. 1986. Atlas of Sulfur Deficiencies. p. 295-322. In M.A. Tabatabai, (ed.) Sulfur in Agriculture. Agron. Monogr. 27. ASA, CSSA, and SSSA. Madison, WI.
Unger, C., D. Flaten, C. Grant, and O. Lukow. 2002. Impact of sulphur fertilizer on spring wheat breadmaking quality. Proceedings of the Great Plains Soil Fertility Conference. Vol 9. Denver, Colorado. March 5-6, 2002. www.ppi-ppic.org.
Veseth, R. and C. Montagne. 1980. Geologic Parent Materials of Montana Soils. Montana Ag. Exper. Stat. Bull. 721.
Wichman, D. 2001. Fertilizer use on dryland perennial forages. Fertilizer Fact #27. Montana State University Extension Service.
Zhao, F.J., M.J. Hankesford, and S.P. McGrath. 1999. Sulphur assimilation and effects on yield and quality of wheat. J. Cereal Sci. 30:1-17.
Appendix
Books
Western Fertilizer Handbook. 9th Edition. 2001. Soil Improvement Committee. California Fertilizer Association. Interstate Publishers. 351 p. (http://agbook.com/westernfertilizerhb.asp) $35 including shipping.
Plant Nutrition Manual. J. Benton Jones, Jr. 1998. CRC Press, Boca Raton, Florida. 149 p. Approximately $50.
Soil Fertility. Foth and Ellis. 1997. CRC Press, Boca Raton, Florida. 290 p.
Soil Fertility and Fertilizers: An Introduction to Nutrient Management. Havlin, J.L., S.L. Tisdale, J..C. Beaton and W.L. Nelson. 7th edition, 2005. Pearson Prentice Hall. Upper Saddle River, New Jersey. 515 p. approx. $100.
Extension Materials
Fertilizer Guidelines for Montana Crops (EB161), single copy is free.
Online at: http://www.montana.edu/wwwpb/ pubs/eb161.html
Or, obtain the above Extension publication (add $1 for shipping) from:
See Web Resources below for online ordering information.
Personnel
Engel, Rick. Associate Professor. Montana State University, Bozeman. (406) 994-5295. engel@montana.edu
Jackson, Grant. Associate Professor. Western Triangle Agricultural Research Center, Conrad. (406) 278-7707. gjackson@montana.edu
Jones, Clain. Extension Soil Fertility Specialist. Montana State University, Bozeman. (406) 994-6076. clainj@montana.edu
Westcott, Mal. Professor. Western Agricultural Research Center, Corvalis. (406) 961-3025. westcott@montana.edu
Wichman, Dave. Associate Professor. Central Agricultural Research Center, Moccasin, (406) 423-5421 dwichman@montana.edu
Web Resources
www.sulphurinstitute.org/ The Sulphur Institute home page offering publications and expertise in worldwide sulfur issues.
http://www.ext.nodak.edu/extpubs/plantsci/soilfert/sf882w.htm Fertilizer recommendation with different soil test results for several crops. Source: NDSU.
http://www.montana.edu/publications Montana State University Publications ordering information for Extension materials
http://Agnotes.org MSU weekly Agronomy Notes by Dr. Jim Bauder on range of issues, including fertilizer management. Currently there are 23 notes on Fertilizer Management, and over 300 Agronomy notes total answering questions from producers, extension agents, and consultants.
http://landresources.montana.edu/FertilizerFacts/ Fertilizer Facts summarizing fertilizer findings and recommendations based on field research conducted in Montana by Montana State University personnel.
Acknowledgments
We would like to extend our utmost appreciation to the following volunteer reviewers who provided their time and insight in making this a better document:
Jeff Farkell, Centrol Ag Consulting, Brady, Montana
Rolan Himes, Rocky Mountain Agronomy Center, Riverton, Wyoming
Grant Jackson, Western Triangle Agricultural Research Center, Conrad, Montana
Sharla Sackman, Prairie County Extension Office, Terry, Montana
Dave Wichman, Central Agricultural Research Center, Moccasin, Montana
Suzi Taylor, MSU Communications Services. Design and layout.