


Water Productivity of Montana Crops
Last Updated: 01/22by Kent McVay, Cropping System Specialist, MSU Extension and Department of Research Centers
Introduction
Crop water productivity (CWP) can be defined as the amount of additional grain or biomass a crop can produce for each added increment of water use. It can be used to estimate yield potential of various crops for the coming season, which helps growers evaluate different crop rotations.
In semi-arid regions, crop yield is generally limited by water. All water used by the crop and not lost to evaporation, runoff, or to competition from weeds can be utilized to increase crop yield. This is one reason why direct seed systems have been successful in Montana. The act of tillage dries soil to the depth of tillage. When crop residue is buried, a darker soil surface is exposed, increasing solar radiation capture, which leads to increased soil evaporation. In contrast, crop residue left on the soil surface acts to trap snow in the winter and retain moisture in the field. In the spring and summer, residue reflects solar radiation and blankets the soil, reducing evaporative loss. The result is in direct seeding systems, increased stored soil water can lead to higher crop yields (Hatfield, et al., 2001, Peterson et al., 1996). These conservation tillage systems provide more reliable annual yields in the semi-arid region, reducing the need for a fallow period. More efficient use of water helps producers diversify to grow pulse, oilseed, and even warm-season crops like corn or millet to the rotational benefit of cereal crop production. Crop water productivity can be used as one criterion to help plan crop sequences. Reliable data on CWP from the region coupled with an understanding of the role soils play in storing water can help producers make informed decisions on which crop to grow next.
Crop rooting depth and distribution
Most crops establish 50% of their root mass in the top 6 to 7 inches of soil (Fan et al., 2016). Even alfalfa, which can grow roots as deep as 12 feet, has 50% of its root mass in the top 7 inches. Depth of rooting can be limited by physical conditions such as shallow bedrock, or by gravel layers. Root growth can also be limited by soil fertility. Data from Montana (Brown, 1971) showed more water was extracted by wheat when soil nitrogen levels were not limiting; this implies that a healthy plant not only grows more biomass above ground, but grows more and deeper roots as well. The dynamics of precipitation rates and timing through the season can have a large impact on crop growth and yield, but in the semi-arid environment the distribution of soil water at the end of the season provides insight into crop rooting patterns.
Differences in water extraction by plants is well illustrated using four years of data from a cropping sequence study conducted in Bozeman by Miller and Holmes (2012). The soil for this study is a uniform, well-drained, Amsterdam silt loam to a depth of at least 6 feet. Available soil water approaches 1.3 inches per foot. All crops compared were capable of extracting water from the top two feet of the profile, so comparing water use from those depths is less useful. Figure 1 shows the average end of season water content for deeper soil depths of 3, 4, 5, and 6 feet. Assuming all depths began with 1.3 inches of available water, it appears all of these crops extracted water from all depths. Safflower and sunflower extract the most water from the profile while pea extracts the least. The pulse crops gained the bulk of soil water from the top 3 feet. Differences at 4 feet indicate lentil can root a little deeper than pea. The small amount of water removed by pulse crops from 5 and 6 feet could be an artifact of removal by previous crops or soil textural variation at depth. Wheat and barley extract water similarly through 4 feet and show some extraction from 5 feet. Safflower and sunflower used nearly all available water through 6 feet of soil profile. Table 1 provides a range of values for rooting depth to be used for calculating available soil water.
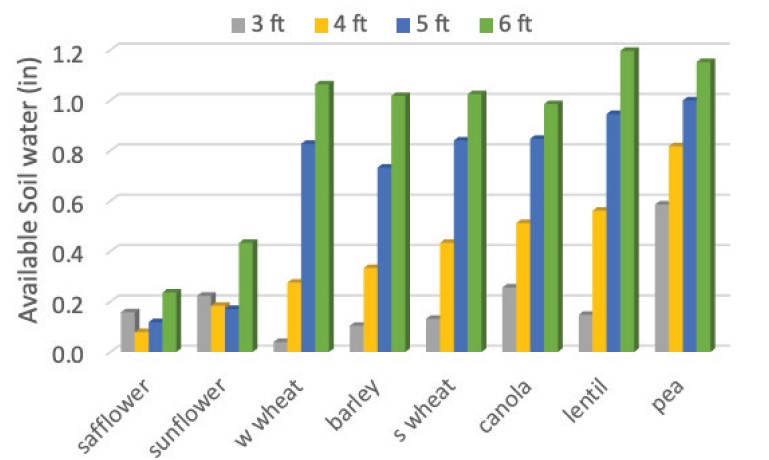
Figure 1: Soil water remaining following harvest of various crops in a cropping systems trial, Bozeman MT.
Table 1. Suggested maximum rooting depths (feet) for Montana crops.
| Crop | Maximum effective rooting depth |
| Winter wheat | 5–6 |
| Spring wheat | 4–5 |
| Barley | 4–5 |
| Lentil | 3–4 |
| Dry pea | 2–3 |
| Chickpea | 3–4 |
| Canola | 3–4 |
| Safflower | 5–6 |
| Sunflower | 5–6 |
| Corn | 5–6 |
Estimating soil water storage
Water stored in the soil profile provides an important buffer for crop production. In humid regions, producers can mostly ignore this bank of water, but in the semi-arid region soil water provides a safety net for rain-fed crop production. On the wet end of the spectrum, a soil is at ‘field capacity’ (FC) following a soaking rain (or irrigation) once drainage has ceased. Here the adsorptive forces (tension) of soil clays and aggregates counters the pull of gravity on water. As soils dry the water content declines to a point where plants can no longer extract water. This point is considered the ‘wilting point’ (WP). The affinity for water from clay surfaces at this point is greater than the pull of water by plant roots. Plant available soil water is the percentage of water that lies between these two extremes. Plant available water varies with soil texture. As soil texture grades from coarse to fine, both FC and WP values increase, but at different rates (Figure 2). Soils that hold the highest percentage of available water are the loams. Clay soils can retain more than 20% water by volume when plants wilt due to an absence of available water, an indication of how tightly water is held by soil clays.
An estimate of stored water at the beginning of the season can be used to help calculate potential crop yield. The Paul Brown moisture probe (www.ams-samplers.com) is a great tool to use for this purpose. This probe is 3½ feet long, made from a rod of ½-inch steel with a ball welded to the tip. The oversized ball enables the user to push the probe down through moist soil while greatly reducing friction when withdrawing the probe, especially in clay soils. The probe will not easily penetrate dry soil. Some probes have a small auger welded to the tip to help retrieve a sample.
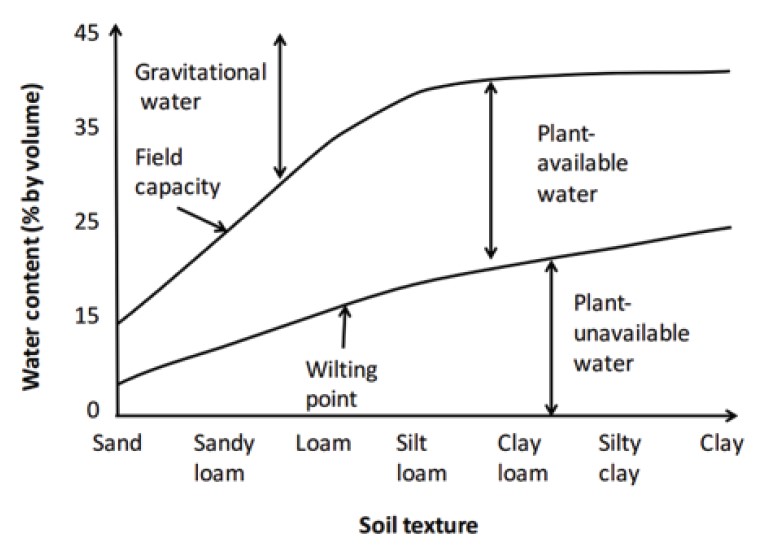
Figure 2: Relationship between soil textural class and water content. Easton and Bock (2015) “Soil and soil water relationships,” BSE-194P, www.ext.vt.edu
In practice the probe is pushed down without turning. When dry soil is reached the probe will abruptly stop. If the stop occurs simultaneously with the sound of a metallic click you most likely have hit a rock. Probing multiple times will provide confidence in the depth of moist soil. Depth of penetration can be measured on the shaft, which is marked in 12-inch increments. A small sample of soil can be obtained from the auger bit for texture estimation by applying pressure and turning the probe clockwise two times while it is in the soil.
Other sampling tools such as soil augers, hydraulic probes, post-hole diggers or shovels can be used to measure the depth of moist soil. Samples from each increment can then be evaluated for moisture, based on feel, appearance, and texture of the soil (Anonymous, 2021). To quantify how much water is available where moisture is found, the soil texture needs to be identified. Soil texture within the profile can be determined locally or by reference to soil maps available through NRCS. Web Soil Survey (websoilsurvey.sc.egov.usda.gov) provides easy online access to a soil description through use of an address or other location information like range and township or latitude/longitude values. The known depth of moist soil is then converted to plant available water using the values from Table 2. If measured in early spring, this value can be added to the amount of precipitation expected in the coming season to help estimate yield potential.
Table 2. Available Water Capacity of Various Textured Soils
| Soil texture | Class | AWC, in/ft |
| Coarse | Fine sand, loamy fine sand | 0.6–1.2 |
| Moderately Coarse | Sandy loam, fine sandy loam | 1.3–1.7 |
| Medium | Sandy clay loam, loam, silt loam | 1.5–2.2 |
| Fine | Clay, clay loam, silty clay loam | 1.6–2.4 |
Precipitation probability
Precipitation patterns in the U.S. Great Plains typically follow a spring rainfall pattern where the majority of annual precipitation occurs between the months of April and June. For example, Great Falls, Montana can expect an annual precipitation amount of 14.7 in, but on average 6.4 in of that amount is received during the three months of April–June (Figure 3) cumulating in 44% of the total annual precipitation. This pattern is similar for all areas of Montana east of the continental divide.
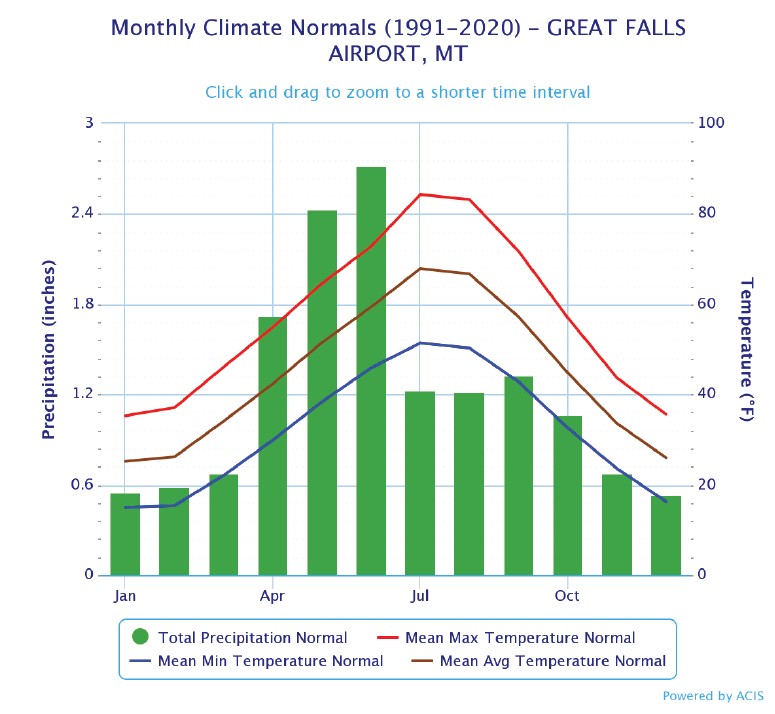
Figure 3: Climate chart for Great Falls, MT, showing monthly average temperature extremes and precipitation amounts. Note the summer precipitation pattern typical of the U.S. Great Plains. http://www.usclimatedata.com/climate/montana/united-states/
The most useful estimate of expected precipitation remains the median, or 50% expectation for making future cropping decisions. The National Weather Service (NWS) currently provides adjustments to this expected mean in terms of wetter than normal, normal, or drier than normal. Using the means from the map in Figure 4 for your location and modifying that amount by the NWS short-term forecast provides a reasonable estimate for precipitation for the coming season. More detailed information can be found online at the Montana Climate Office (climate.umt.edu/).
Water productivity indices for Montana
Water productivity for crops varies widely depending on environmental conditions. Tanaka et al. (2007) conducted a cropping systems study at Mandan, ND, using 10 different crops including spring wheat over a 2-year period. They estimated water use as precipitation use efficiency. In a similar fashion Miller and Holmes (2012) used a cropping systems study near Bozeman to compare the response of seven to nine different crops including spring wheat to previous crops. Water productivity in this study can be estimated from their reported measurements of residual soil moisture following harvest. A three-year study specifically looking at pea, chickpea, and spring wheat water use efficiency is currently underway at Huntley and Sidney, MT, where a full water balance is measured using drip irrigation at different rates to supplement precipitation. Table 3 was constructed using the average of spring wheat CWP over the Montana multi-year studies. The CWP value for all other crops is calculated as the relative response to spring wheat, averaged over all three studies, multiplied by the average spring wheat CWP.
Steps for estimating yield potential
Crop yield potential for the coming season can be estimated by combining all of this information. Follow the steps below to determine the yield potential for crops commonly grown in Montana.
- Determine the soil type for the field. Most fields contain more than one soil type, so consider using the soil type that dominates or estimating stored water based on sub-units. Note the depth and soil texture of each horizon.
- Determine the depth of moist soil; check with a soil probe at multiple locations within the field or subunit, and compile an average.
- Calculate the plant available water for each depth using available soil water by texture (Table 2) through the rooting depth of the crop to be grown (Table 1).
- Determine the expected precipitation to be received using Figure 4 and adjust depending on the current, long-term forecast for the region.
- Potential crop yield is estimated using the sum of expected available water from steps 3 and 4 multiplied by the CWP value for the chosen crop from Table 3. (See calculation example in Box 1.)
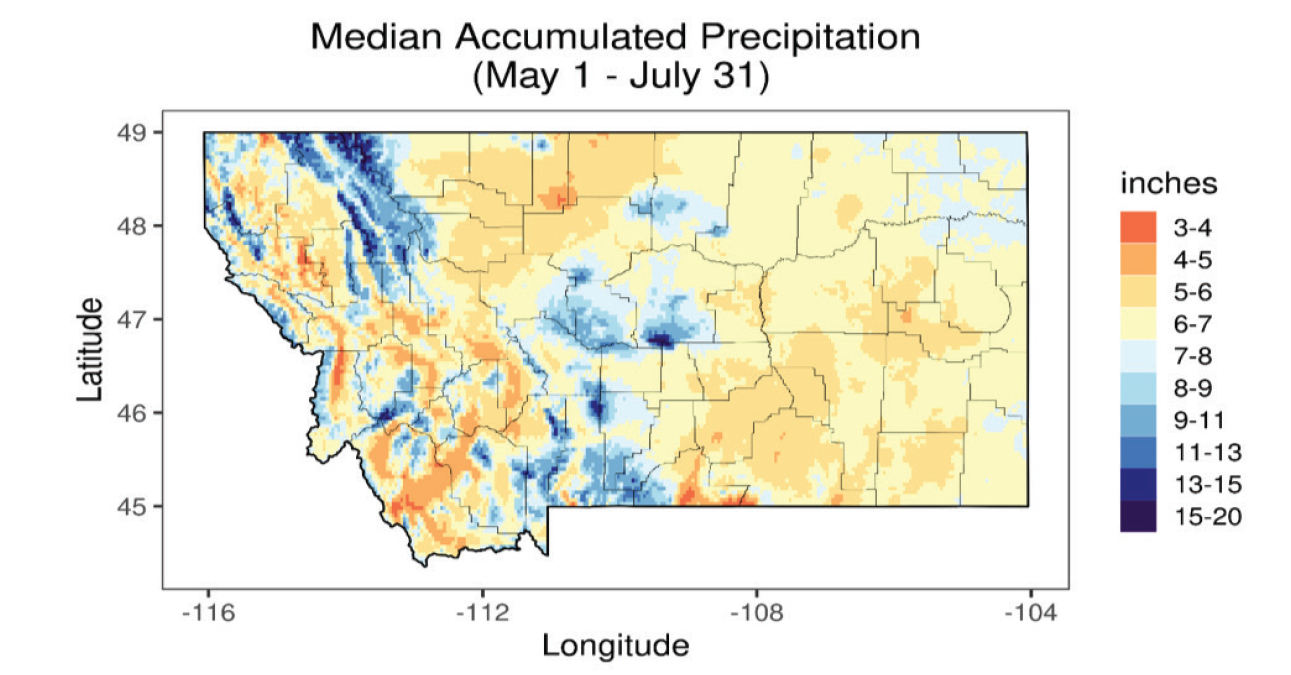
Figure 4: Amount of precipitation that is equaled or exceeded in 50 percent of the years, May 1–July 31 (inches). Based on daily precipitation totals recorded at cooperative sites from 1979–2019. Use this link to locate a more precise value for your field: https://mco.cfc.umt.edu/precipitation/precip_probs.html.
Summary
Using the values in this publication to estimate yield potential assumes only water is limiting yield. Proper management practices such as using adapted varieties, planting crops at recommended seeding depths and rates, providing good weed and disease control, inoculating all pulse crops and fertilizing per soil tests should also be managed as to not limit yield. If the prediction from this method exceeds the historical field average, then use the historical average as the yield goal.
Before planting a next crop, consider the current status of soil moisture and the outlook for precipitation over the next few months for the location (Figure 3) and plan accordingly. The chances of receiving large amounts of fall precipitation are low across most of Montana and planting a winter wheat crop into dry soil risks emergence and then drought stress or death when there is little soil moisture to sustain growth. This is especially true in early fall when warm air temperature encourages vigorous wheat growth and tillering. Without a safety net of soil moisture, seedlings can quickly exhaust what moisture is present. Planting later in the fall will use less moisture, but then risks a poor rooting system going into dormancy with an increased risk of winter kill. In some years altering the rotation to delay planting until spring might be a better decision. The delay allows time for winter precipitation to recharge the soil profile and provide a buffer of available water once a crop is planted.
Table 3. Crop water productivity (pounds or bushels/ac/inch) for selected crops grown in Montana. (Data combined from Tanaka et al, 2007, Miller and Holmes, 2011, McVay et al., 2021).
| Crop | CWP | |
| Lb | bu | |
| Winter wheat | 252 | 4.2 |
| Spring wheat | 251 | 4.2 |
| Spring barley | 197 | 4.1 |
| Pea | 165 | 2.7 |
| Lentil | 101 | 1.7 |
| Chickpea | 146 | 2.5 |
| Canola | 87 | 1.7 |
| Sunflower | 116 | 3.9 |
| Safflower | 242 | 5.8 |
| Corn | 209 | 3.7 |
| Millet | 232 | 4.6 |
Making the decision of which crop to grow is complicated. Economics play an important role and so does pest management, but CWP and available water for the coming season are also important factors. Using an estimate of stored soil water and adding in expected precipitation provides a good estimate of water that will be available to a crop for the coming season. Multiplying that water amount by CWP provides yield estimates to help make better cropping decisions.
References
Anonymous. 2021. Guide for estimating soil moisture. http://www.nrcs.usda.gov/wps/poral/nrcs/detail/ca/newsroom/factsheets/?cid=nrcs144p2_064138
Brown, P.L. 1971. Water use and soil water depletion by dryland winter wheat as affected by nitrogen fertilization. Agron. J. 63:43-46.
Easton, Z.M., and E. Bock. 2015. Soil and soil water relationships. BSE-194P. Virginia Cooperative Extension. https://digitalpubs.ext.vt.edu/vcedigitalpubs/2481933593189246/MobilePagedReplica
Fan, J., B. McConkey, H. Wang, and H. Janzen. 2016. Root distribution by depth for temperate agricultural crops. Field Crops Research 189:68-74.
Hatfield, J.L., T.J. Sauer, and J.H. Prueger. 2001. Managing soils to achieve greater water use efficiency: A review. Agron. J. 93:271-280.
McVay, K.A., Q.A. Khan, C. Chen, and W. Franck. 2021. Understanding chickpea and dry pea water use to build better crop rotations. Annual Report to Montana Department of Agriculture. http://www.sarc.montana.edu/php/annrpt/.
Miller, P.R. and J.A. Holmes. 2012. Short Communication: Comparative soil water use by annual crops at a semiarid site in Montana. Can. J. Plant Sci. 92: 803-807. doi:10.4141/ CJPS2011-191
Peterson, G.A., A.J. Schlegel, D.L. Tanaka, O.R. Jones. 1996. Precipitation use efficiency as affected by cropping and tillage systems. Journal Prod. Ag. 9:180-186.
Tanaka, D.L., J.M. Krupinsky, S.D. Merrill, M.A. Liebig, and J.D. Hanson. 2007. Dynamic cropping systems for sustainable crop production in the northern Great Plains. Agron. J. 99:904-911. doi:10.2134/agronj2006.0132
WEBSITES
AMS Soil sampling equipment https://www.ams-samplers.com
Montana Climate Office https://climate.umt.edu/
Precipitation Probabilities Maps (Interactive). https://mco.cfc.umt.edu/precipitation/precip_probs.html Montana Climate Office, University of Montana.
U.S. Climate Data, Montana Table https://www.usclimatedata.com/climate/montana/united-states/
Web Soil Survey. https://websoilsurvey.sc.egov.usda.gov/App/HomePage.htm, United States Department of Agriculture, Natural Resources Conservation Service.
Box 1. Calculation example
Assume it is March, and your field has moist soil to 48.” The soil profile is described below. The field is located in Cascade County, MT. From Figure 4, estimate this field should receive 5 inches of precipitation from May 1 to July 31.
Available soil water for spring wheat (4 feet)
| Horizon description | Depth (ft) | SWC1 | Available soil water (in) | ||
| sandy loam | A | 0–0.5 | 0.5 | 1.3 | 0.65 |
| silt loam | Bt | 0.5–1 | 0.5 | 2.2 | 1.1 |
| loam | Bk | 1–4 | 3.0 | 1.8 | 5.4 |
| Total | 7.15 | ||||
Available soil water for pea (3 feet)
| Horizon description | Depth (ft) | SWC1 | Available soil water (in) | ||
| sandy loam | A | 0–0.5 ft | 0.5 | 1.3 | 0.65 |
| silt loam | Bt | 0.5–1 ft | 0.5 | 2.2 | 1.1 |
| loam | Bk | 1–3.5 ft | 2.0 | 1.8 | 3.6 |
| Total | 5.35 | ||||
Available soil water for safflower (5 feet)
| Horizon description |
Depth (ft) | SWC1 | Available soil water (in) | ||
| sandy loam | A | 0–0.5 ft | 0.5 | 1.3 | 0.65 |
| silt loam | Bt | 0.5–1 ft | 0.5 | 2.2 | 1.1 |
| loam | Bk | 1–5 ft | 4 | 1.8 | 7.2 |
| Total | 8.95 | ||||
Expected crop yield
| Crop | Soil water (in) | Precipitation1 (in) | Seasonal water2 (in) |
CWP3
bu/ac/in
|
Expected Yield (bu/a) |
| Spring wheat | 7.15 | 5 | 12.15 | 3.8 | 46 |
| Pea | 5.35 | 5 | 10.35 | 2.5 | 26 |
| Safflower | 8.95 | 5 | 13.95 | 3.0 | 42 |
1 Estimate from Figure 4.
2 Sum of columns 1 and 2.
3 Value from Table 2.